DeMark Diffusion™ - S&P 500 Top & Bottom 10 - 2025-09-28

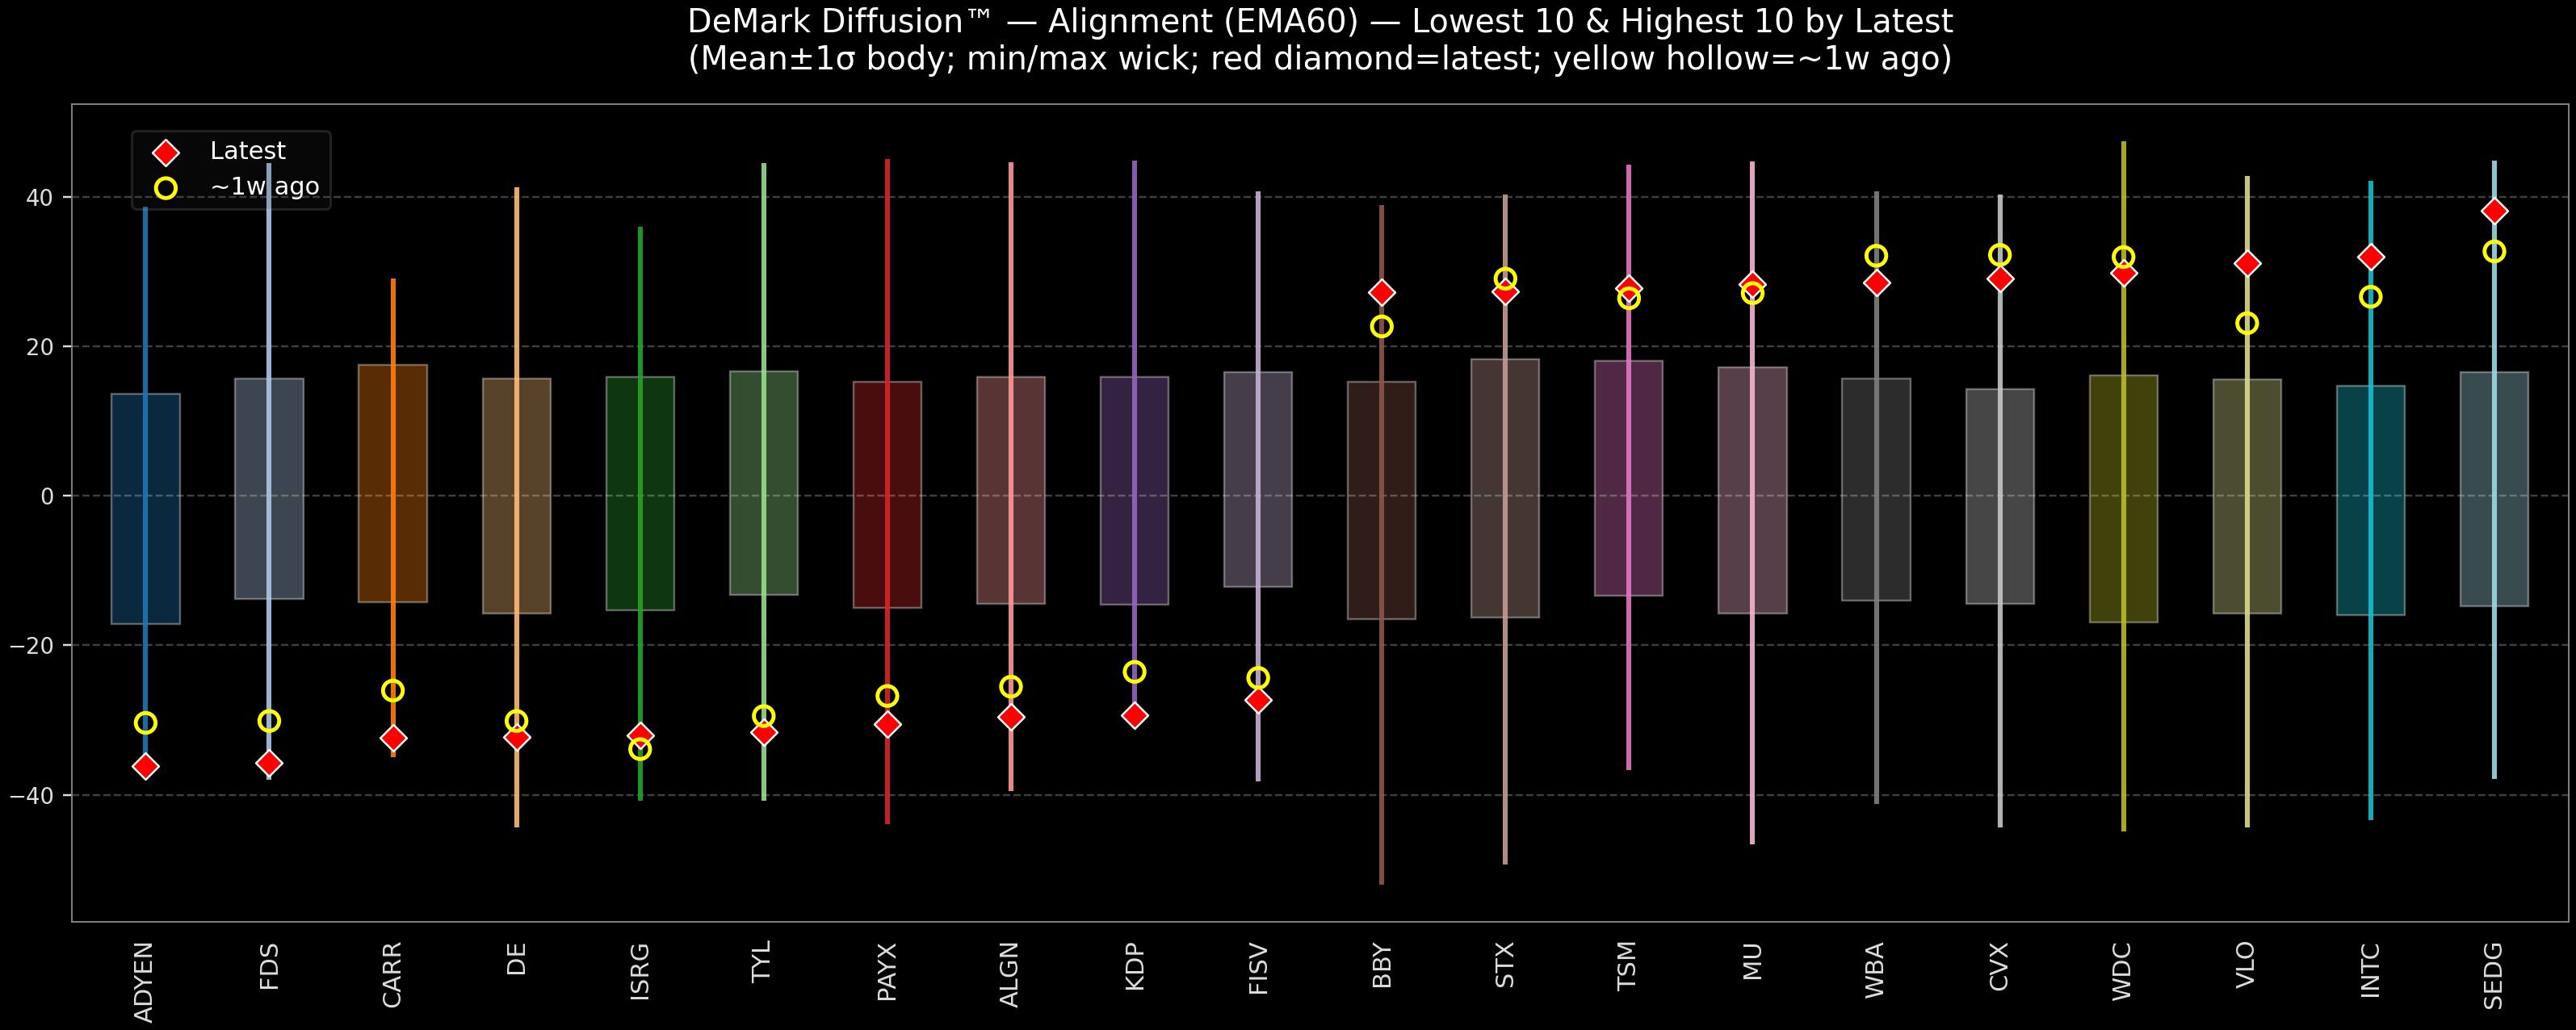
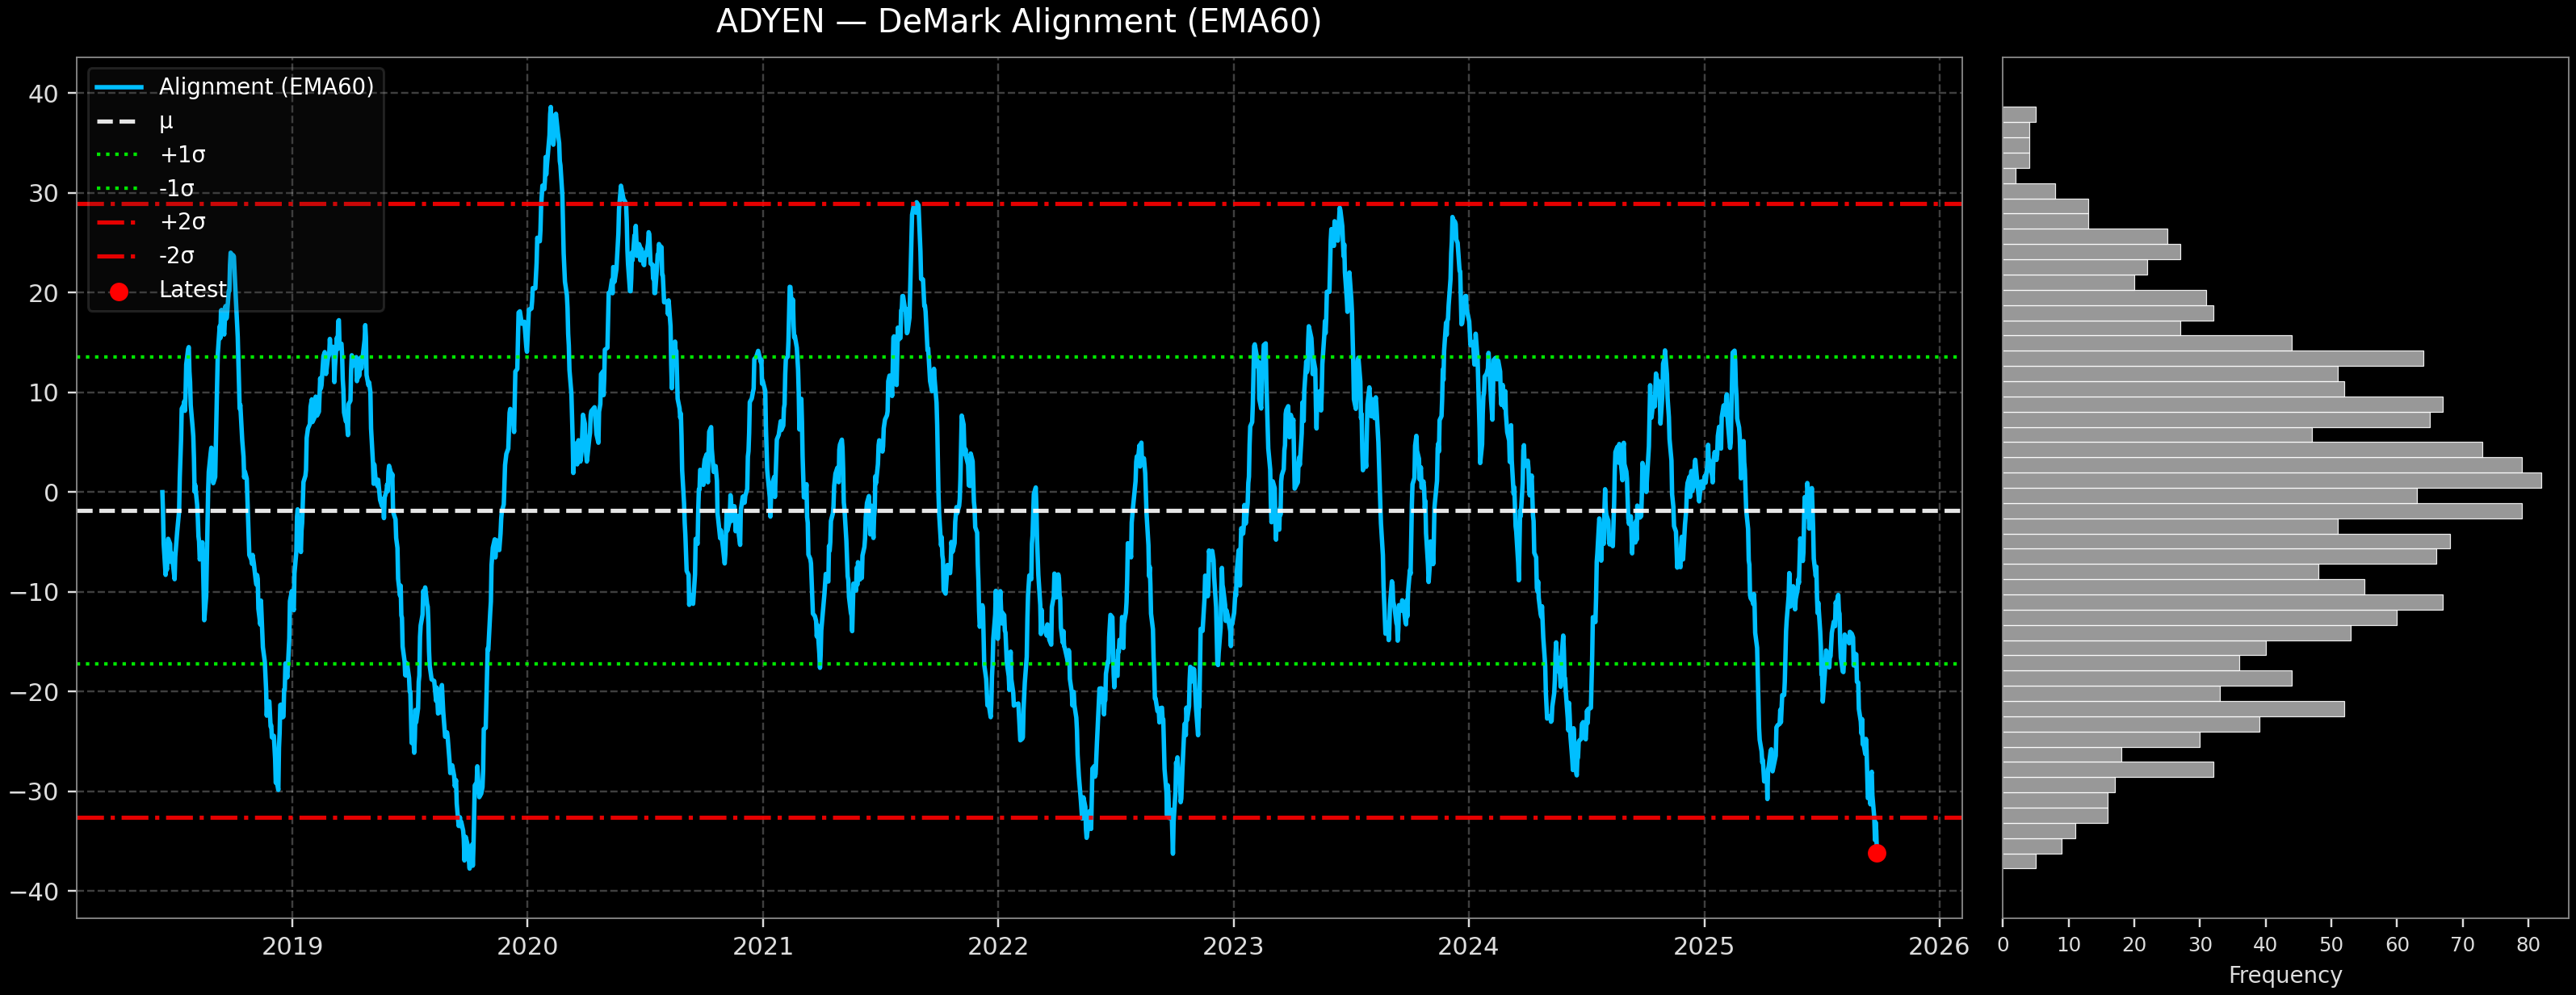
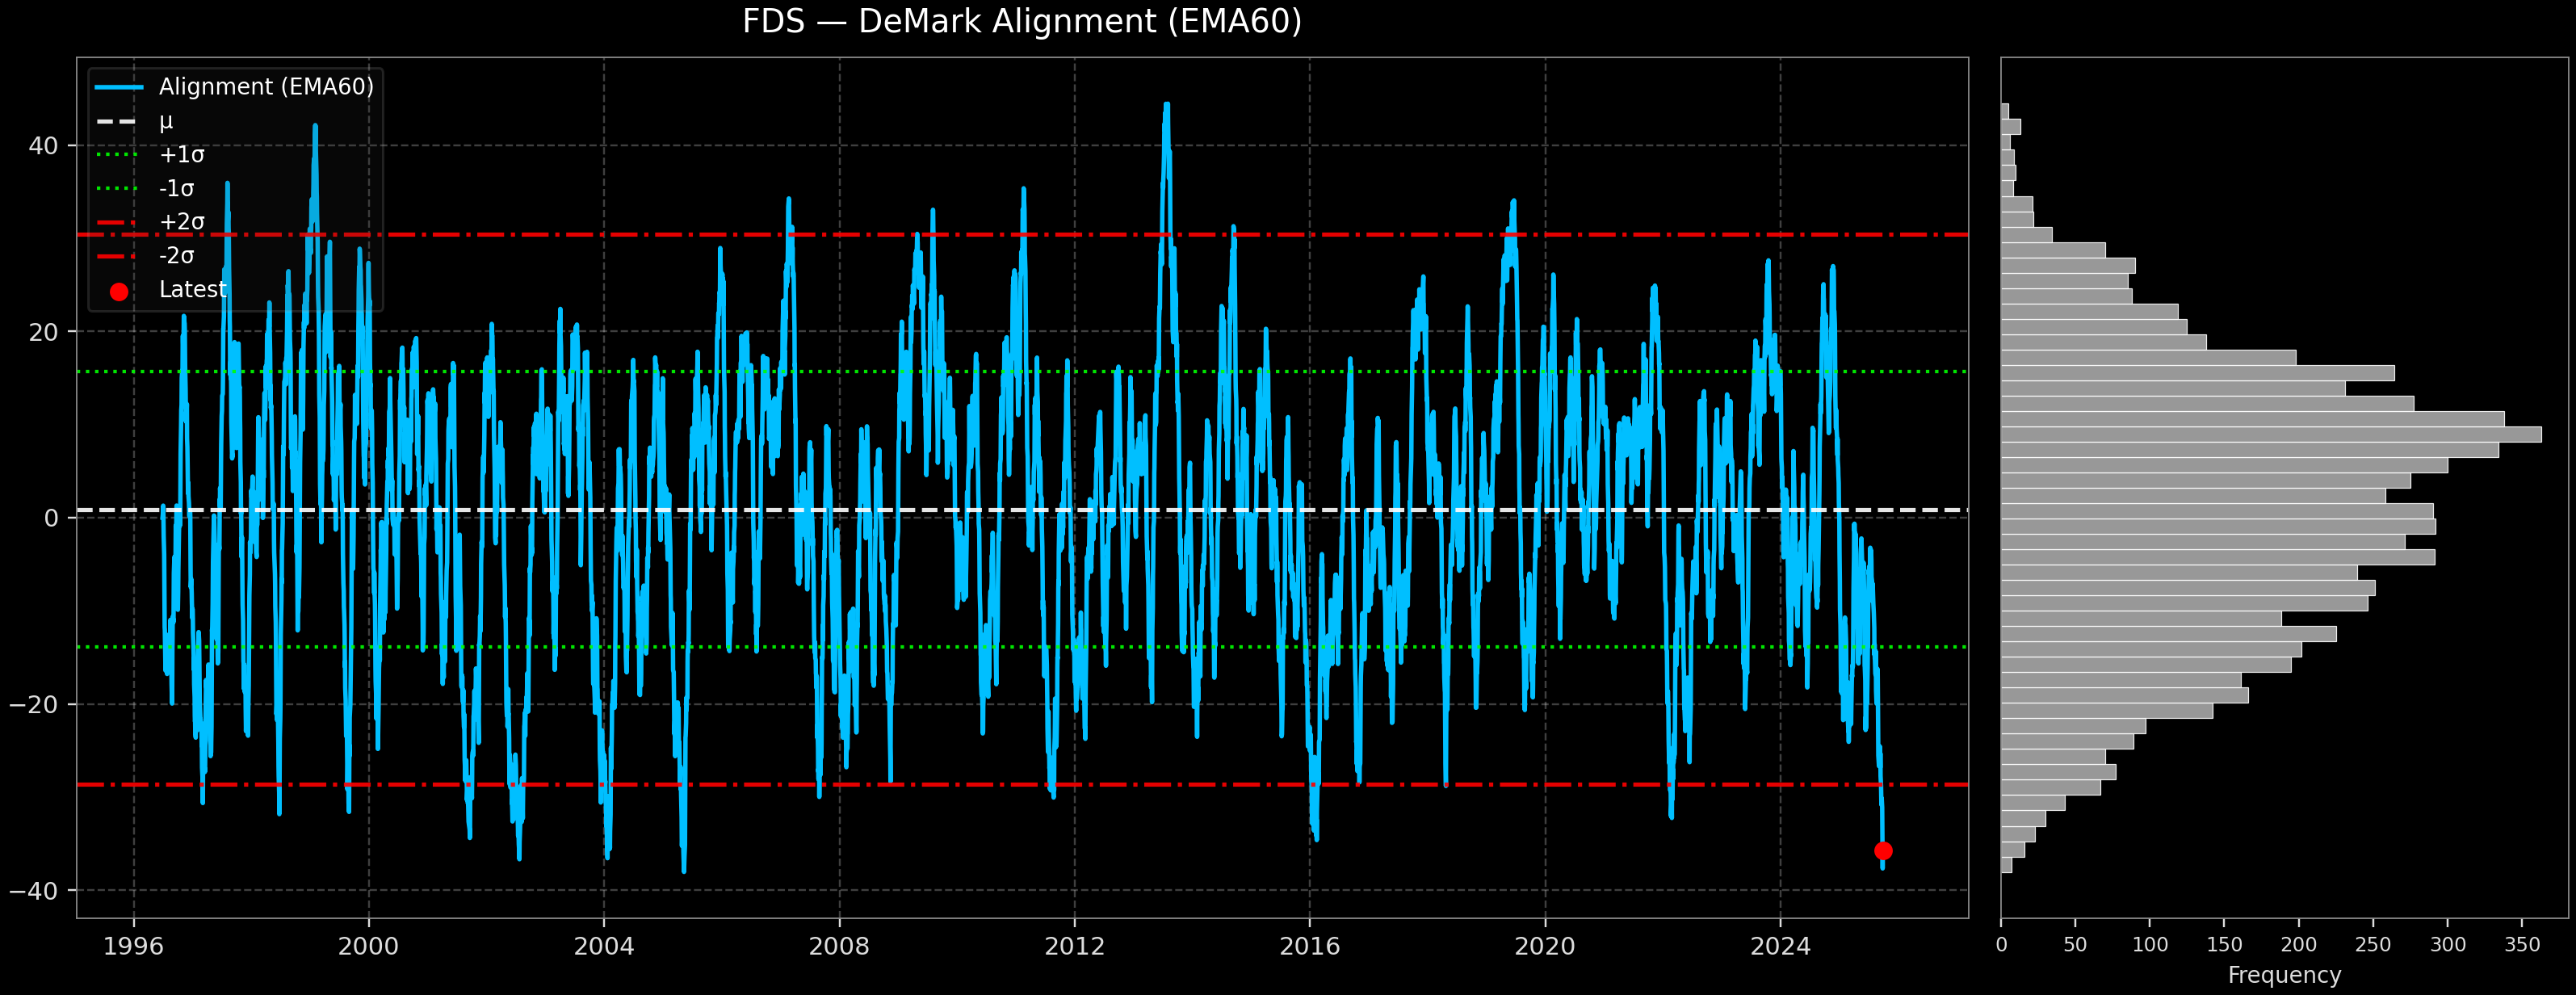
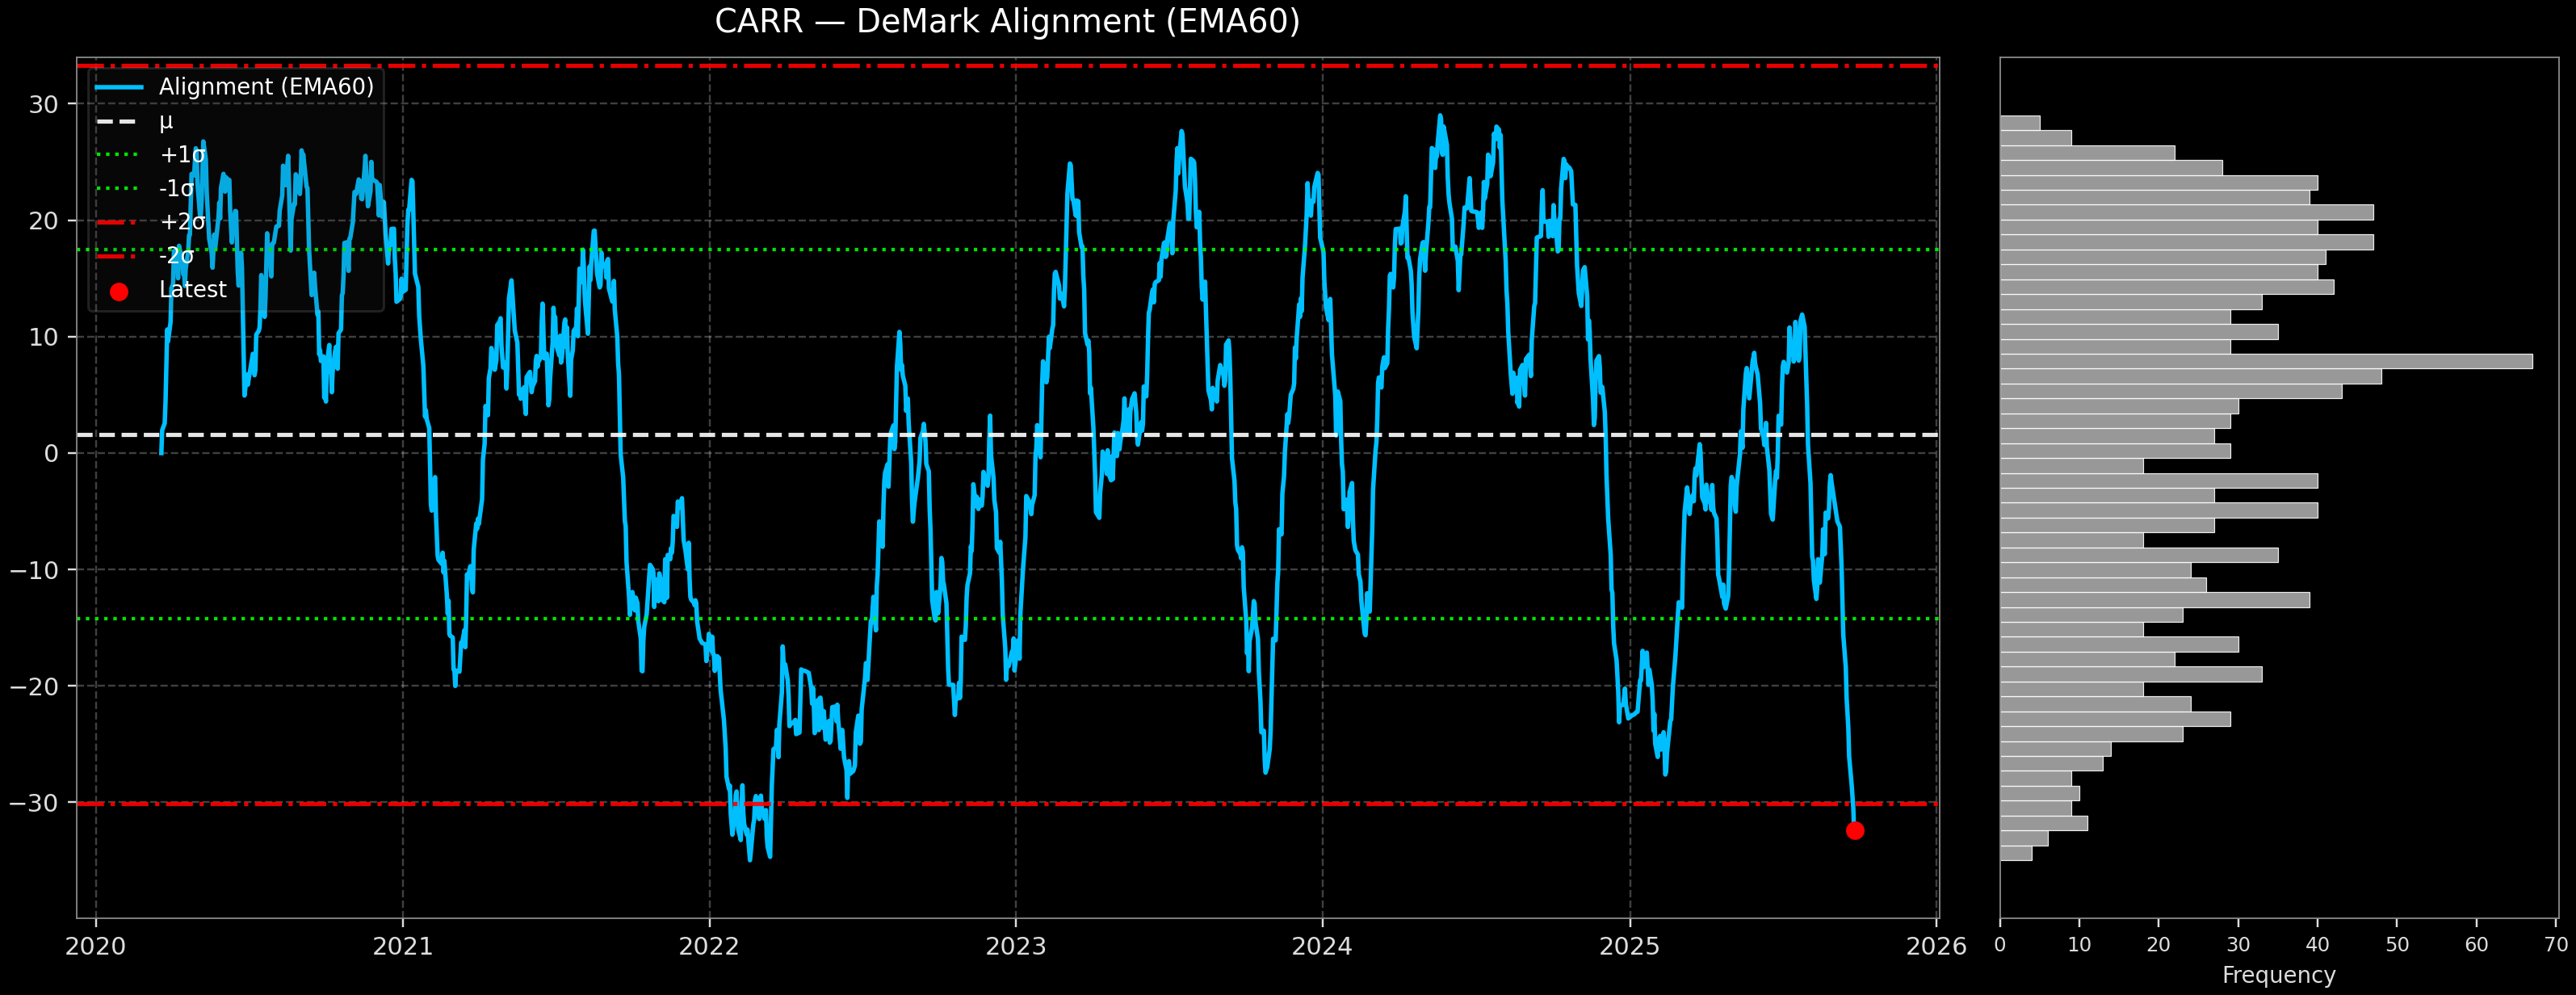
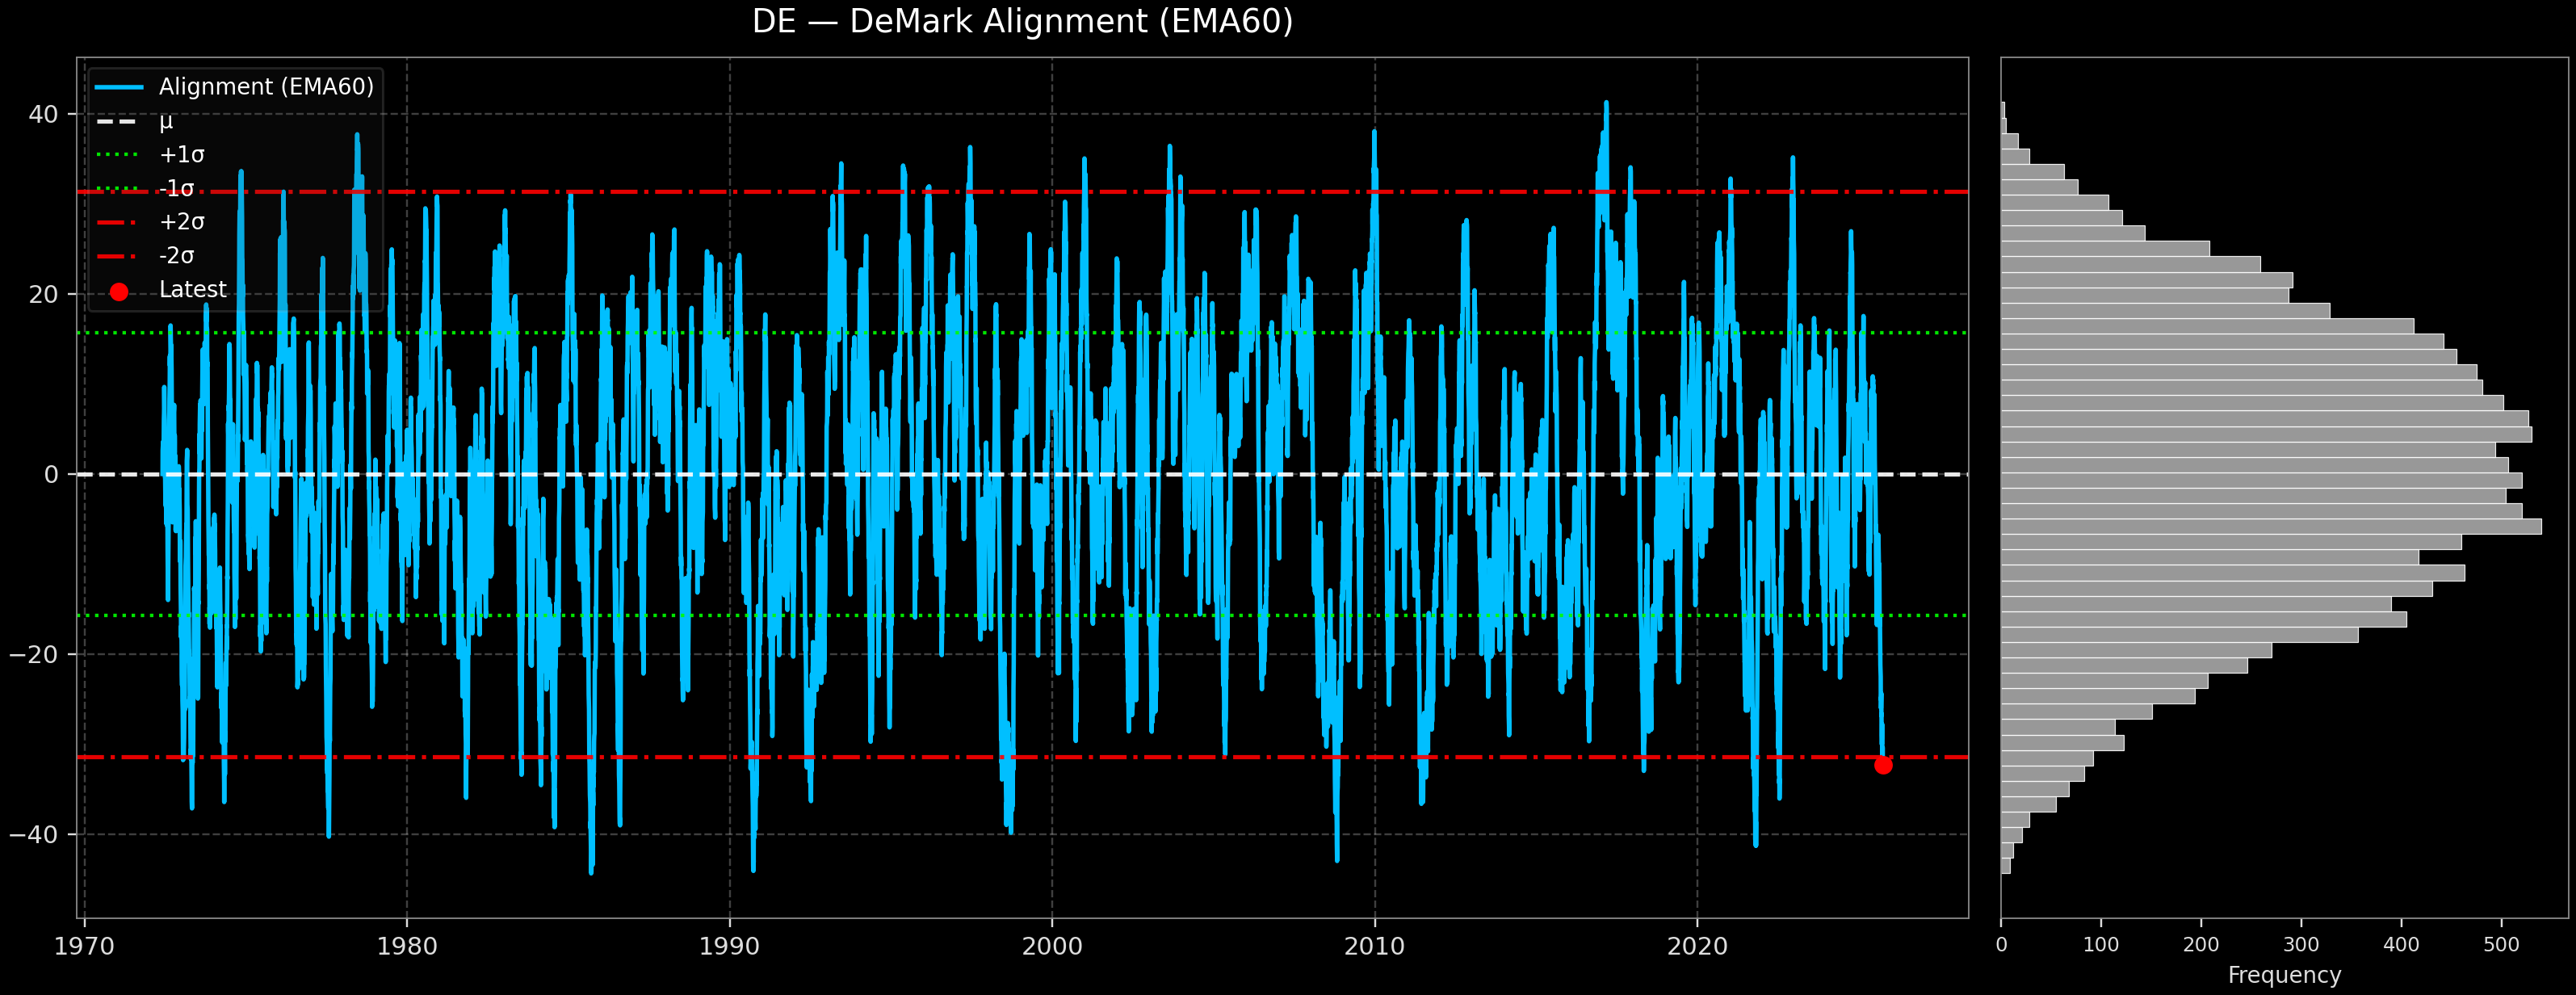
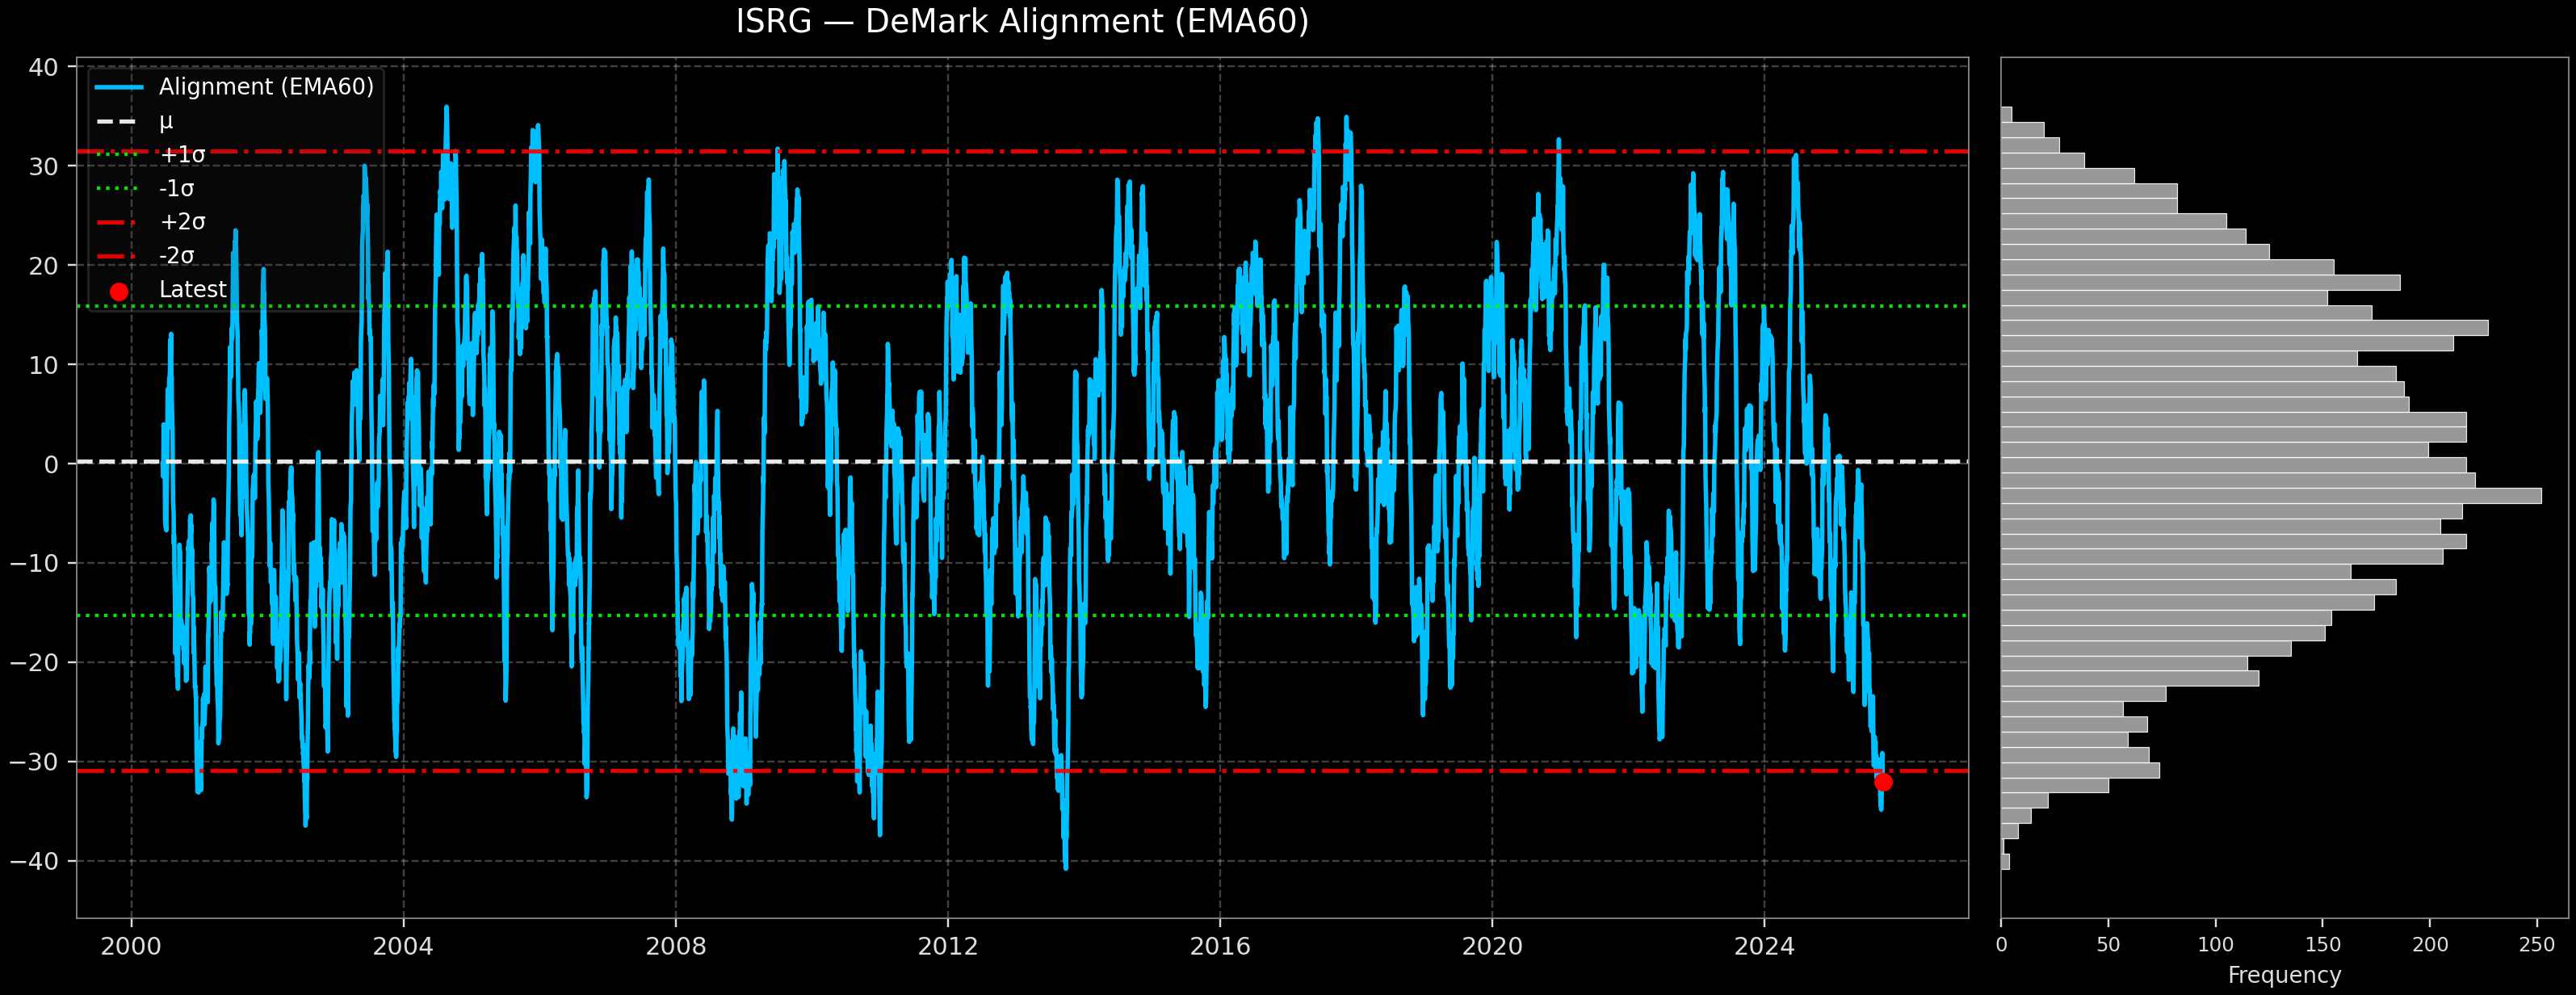
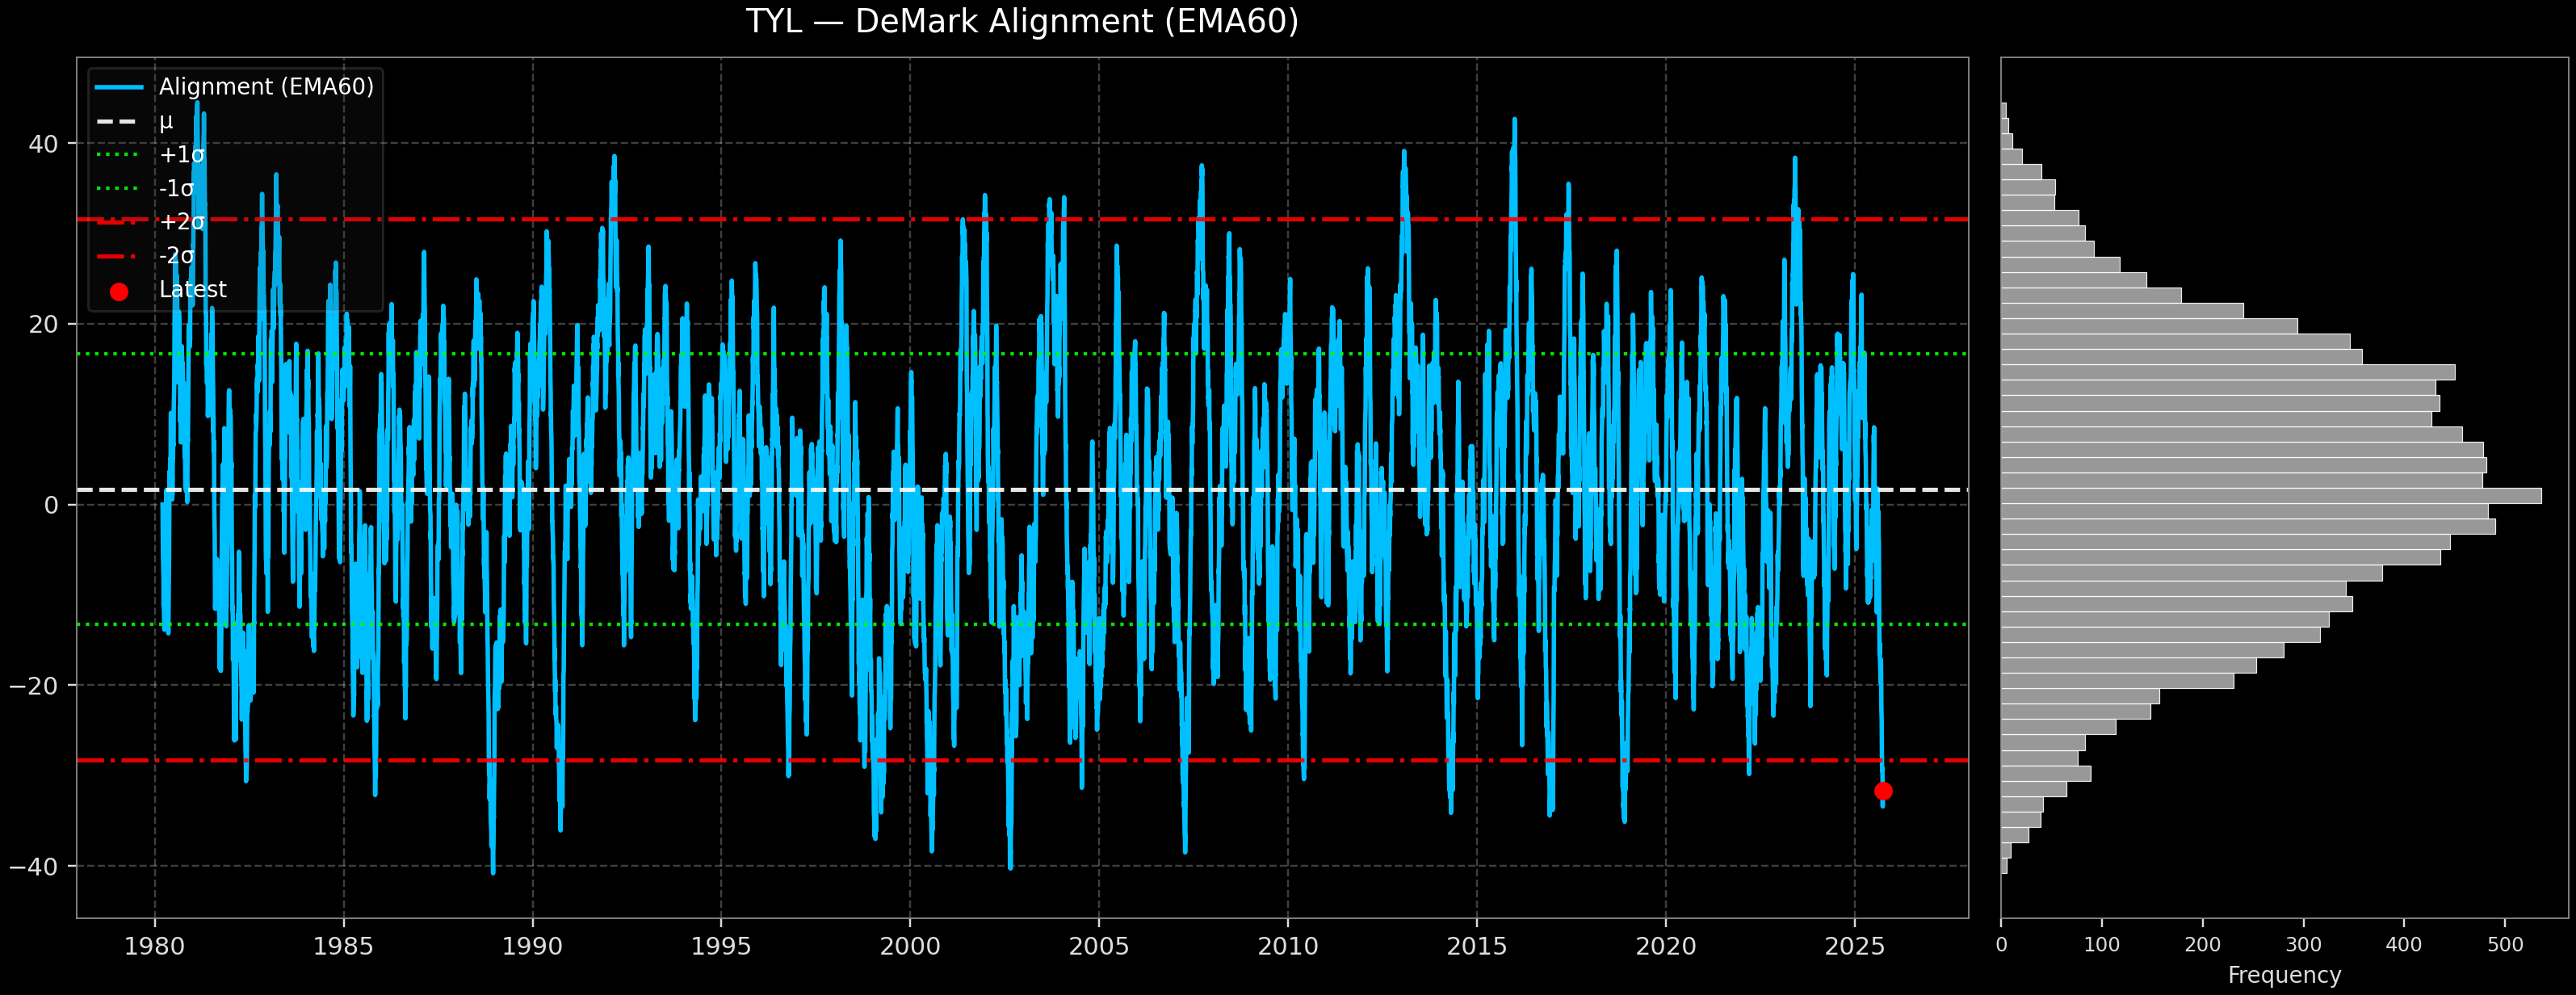
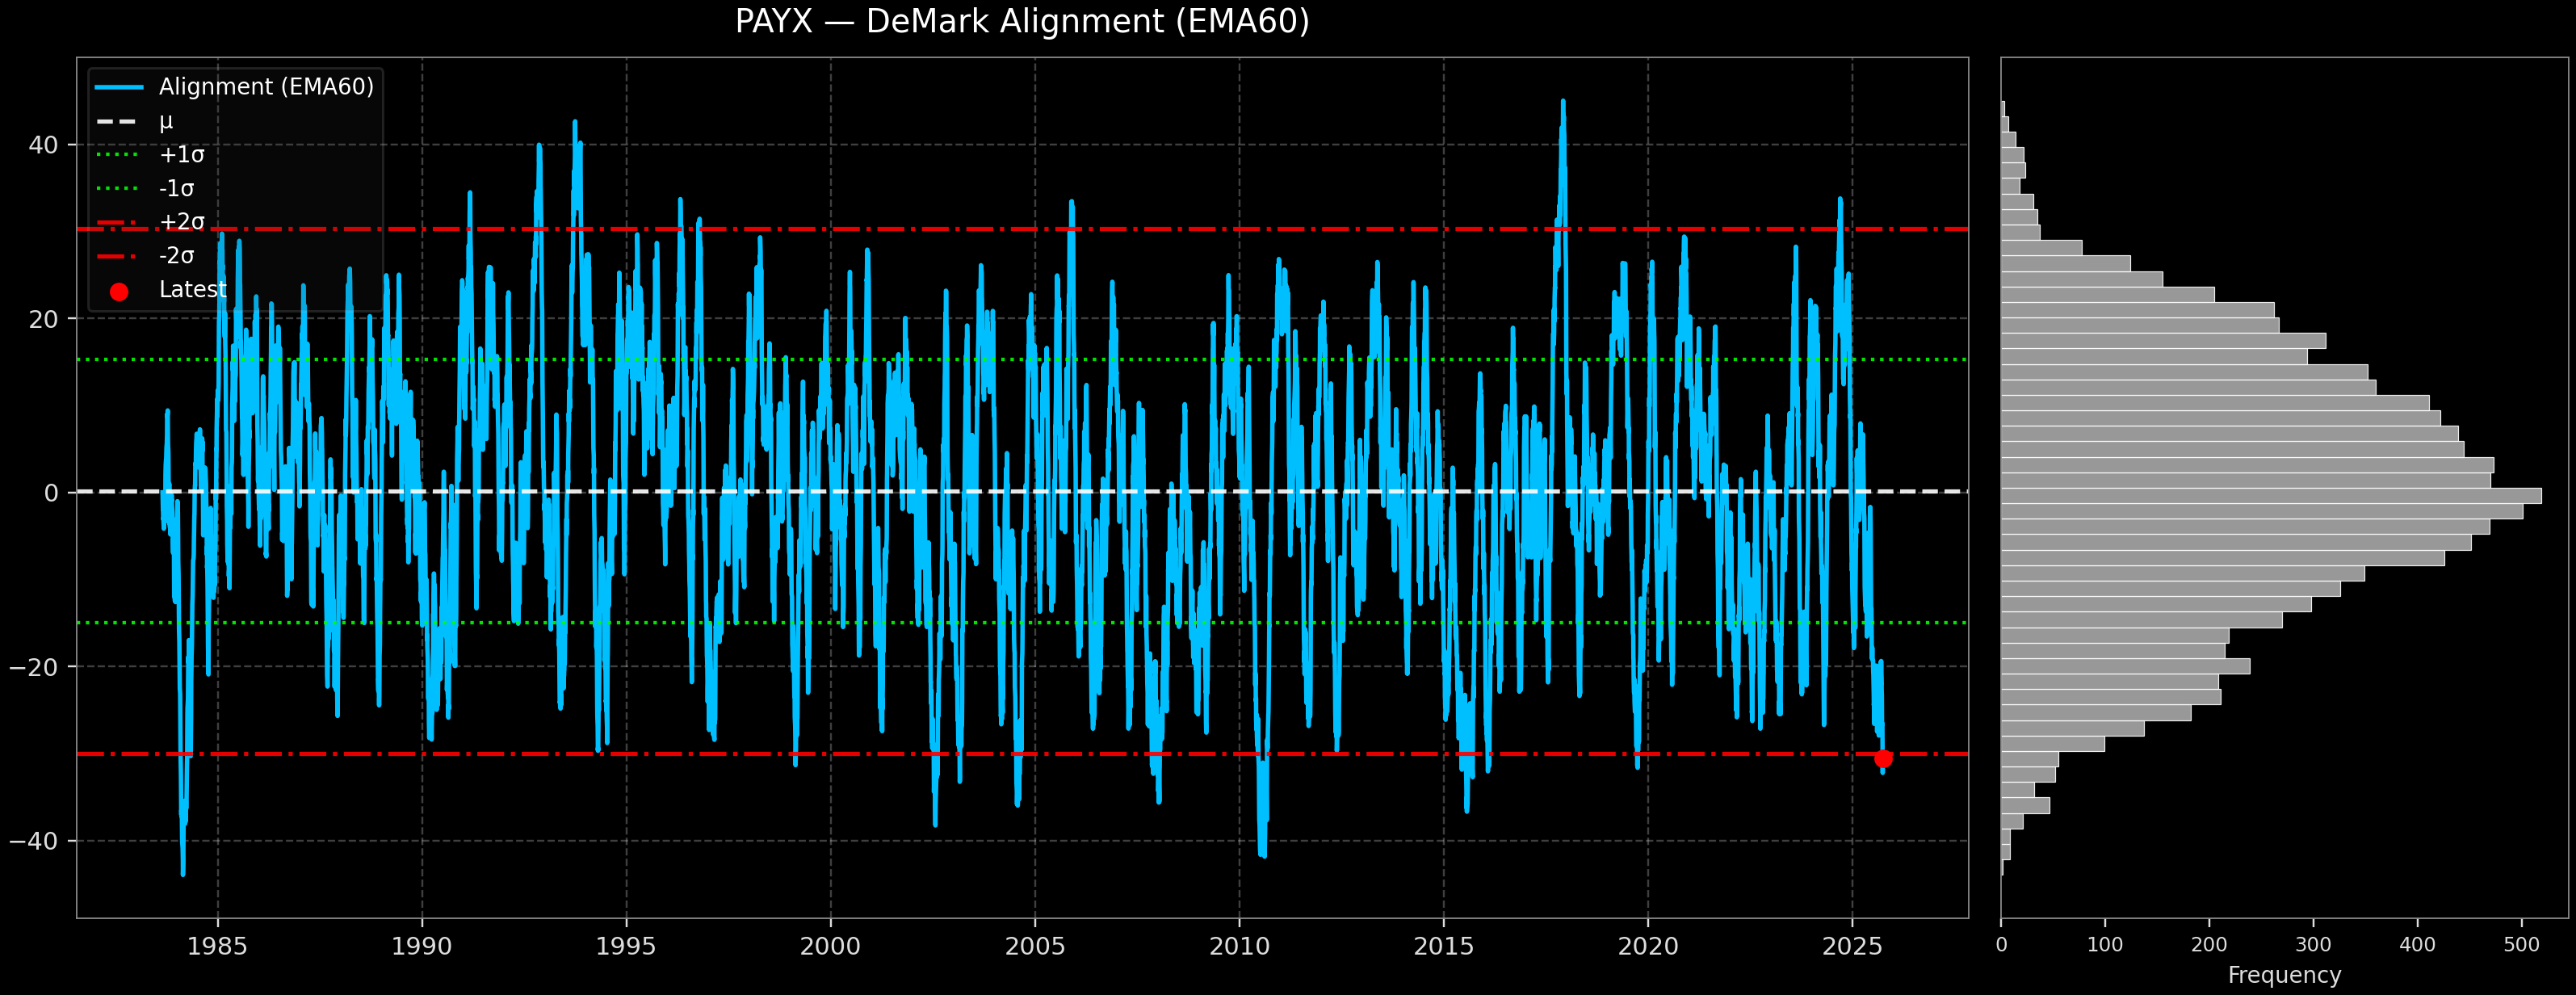
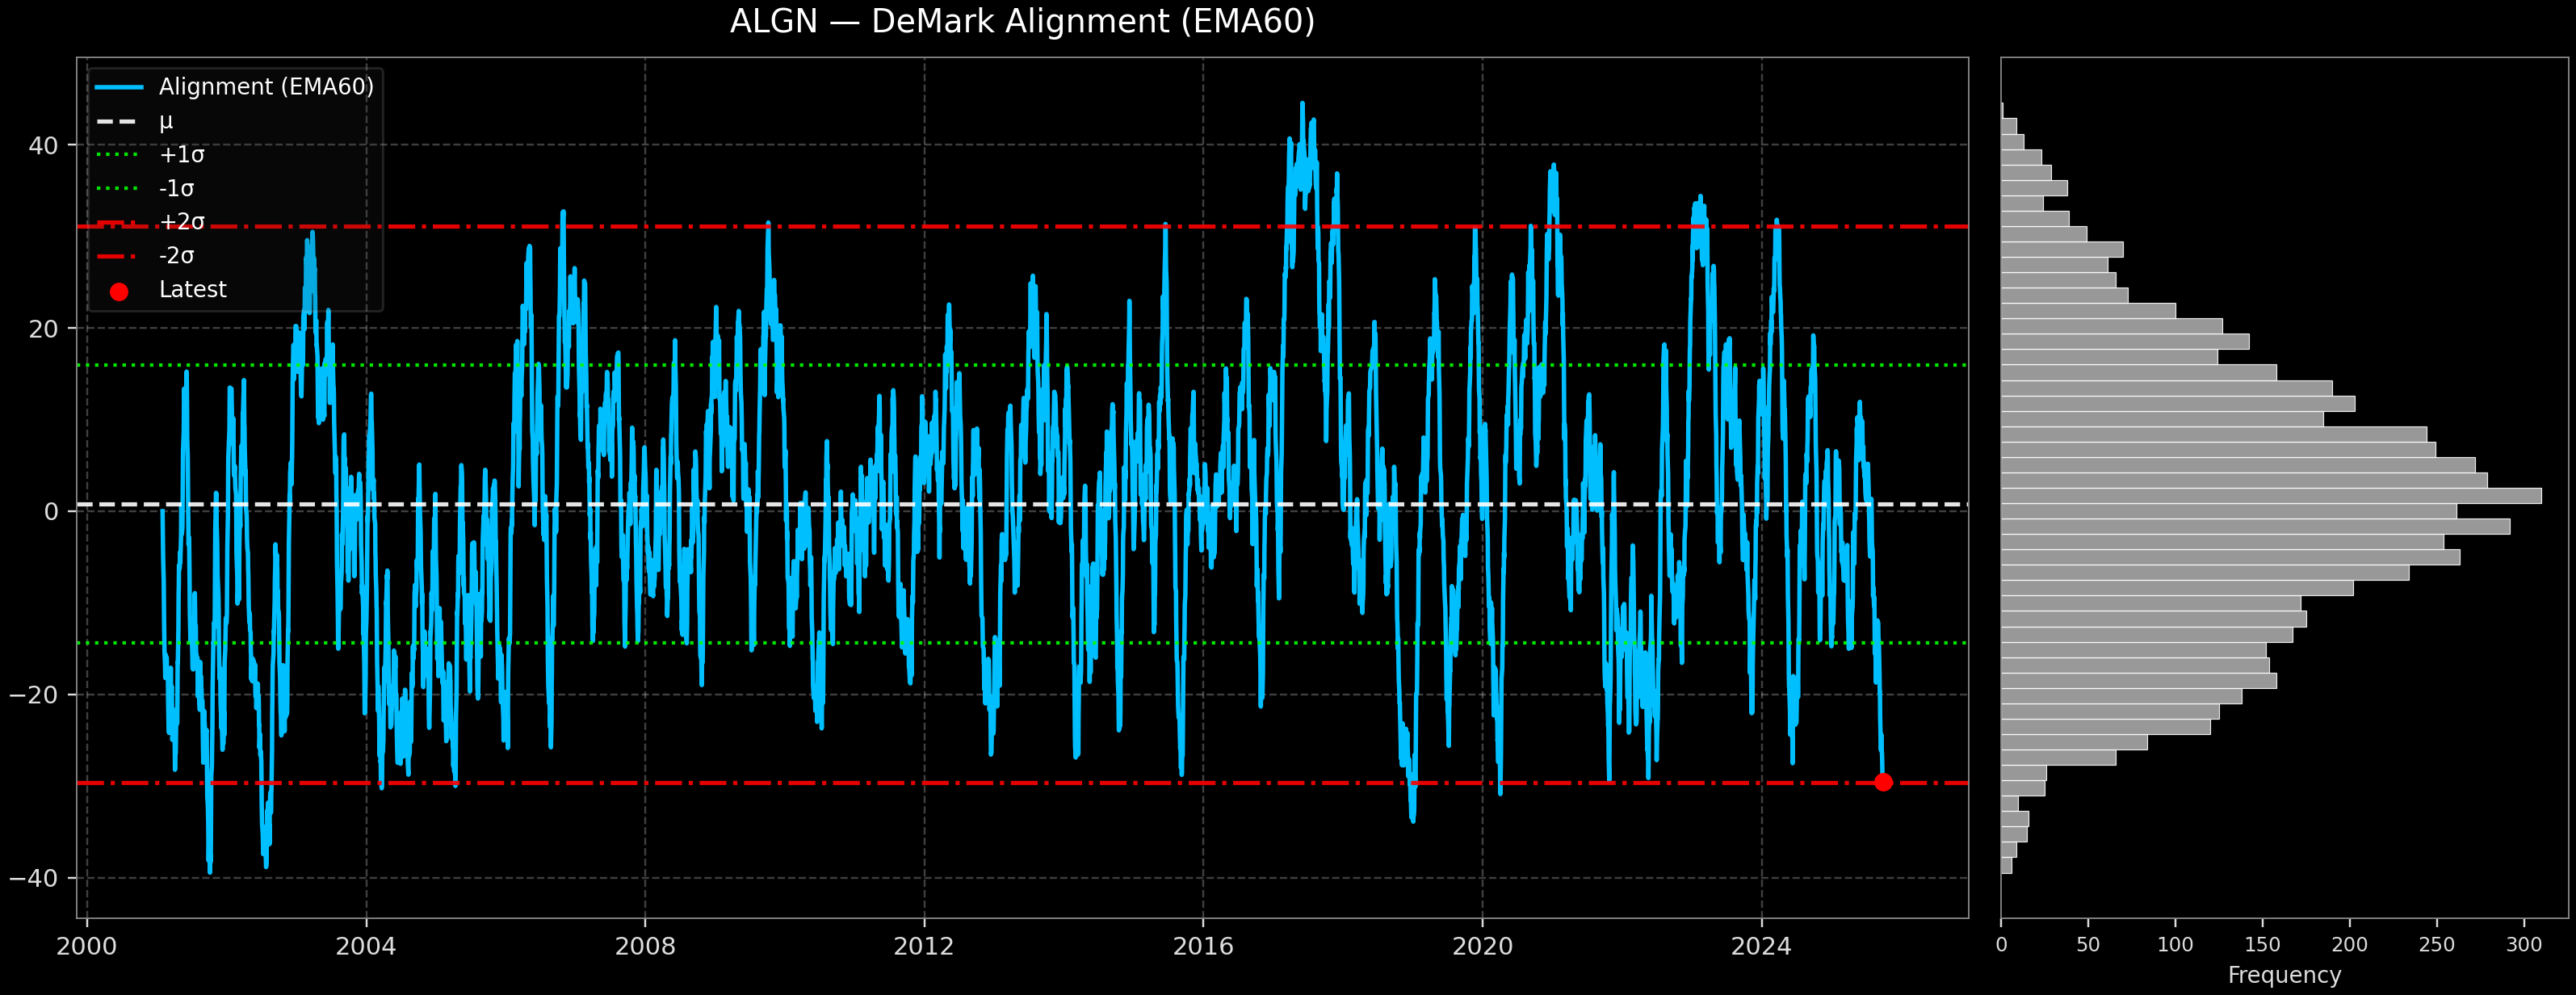
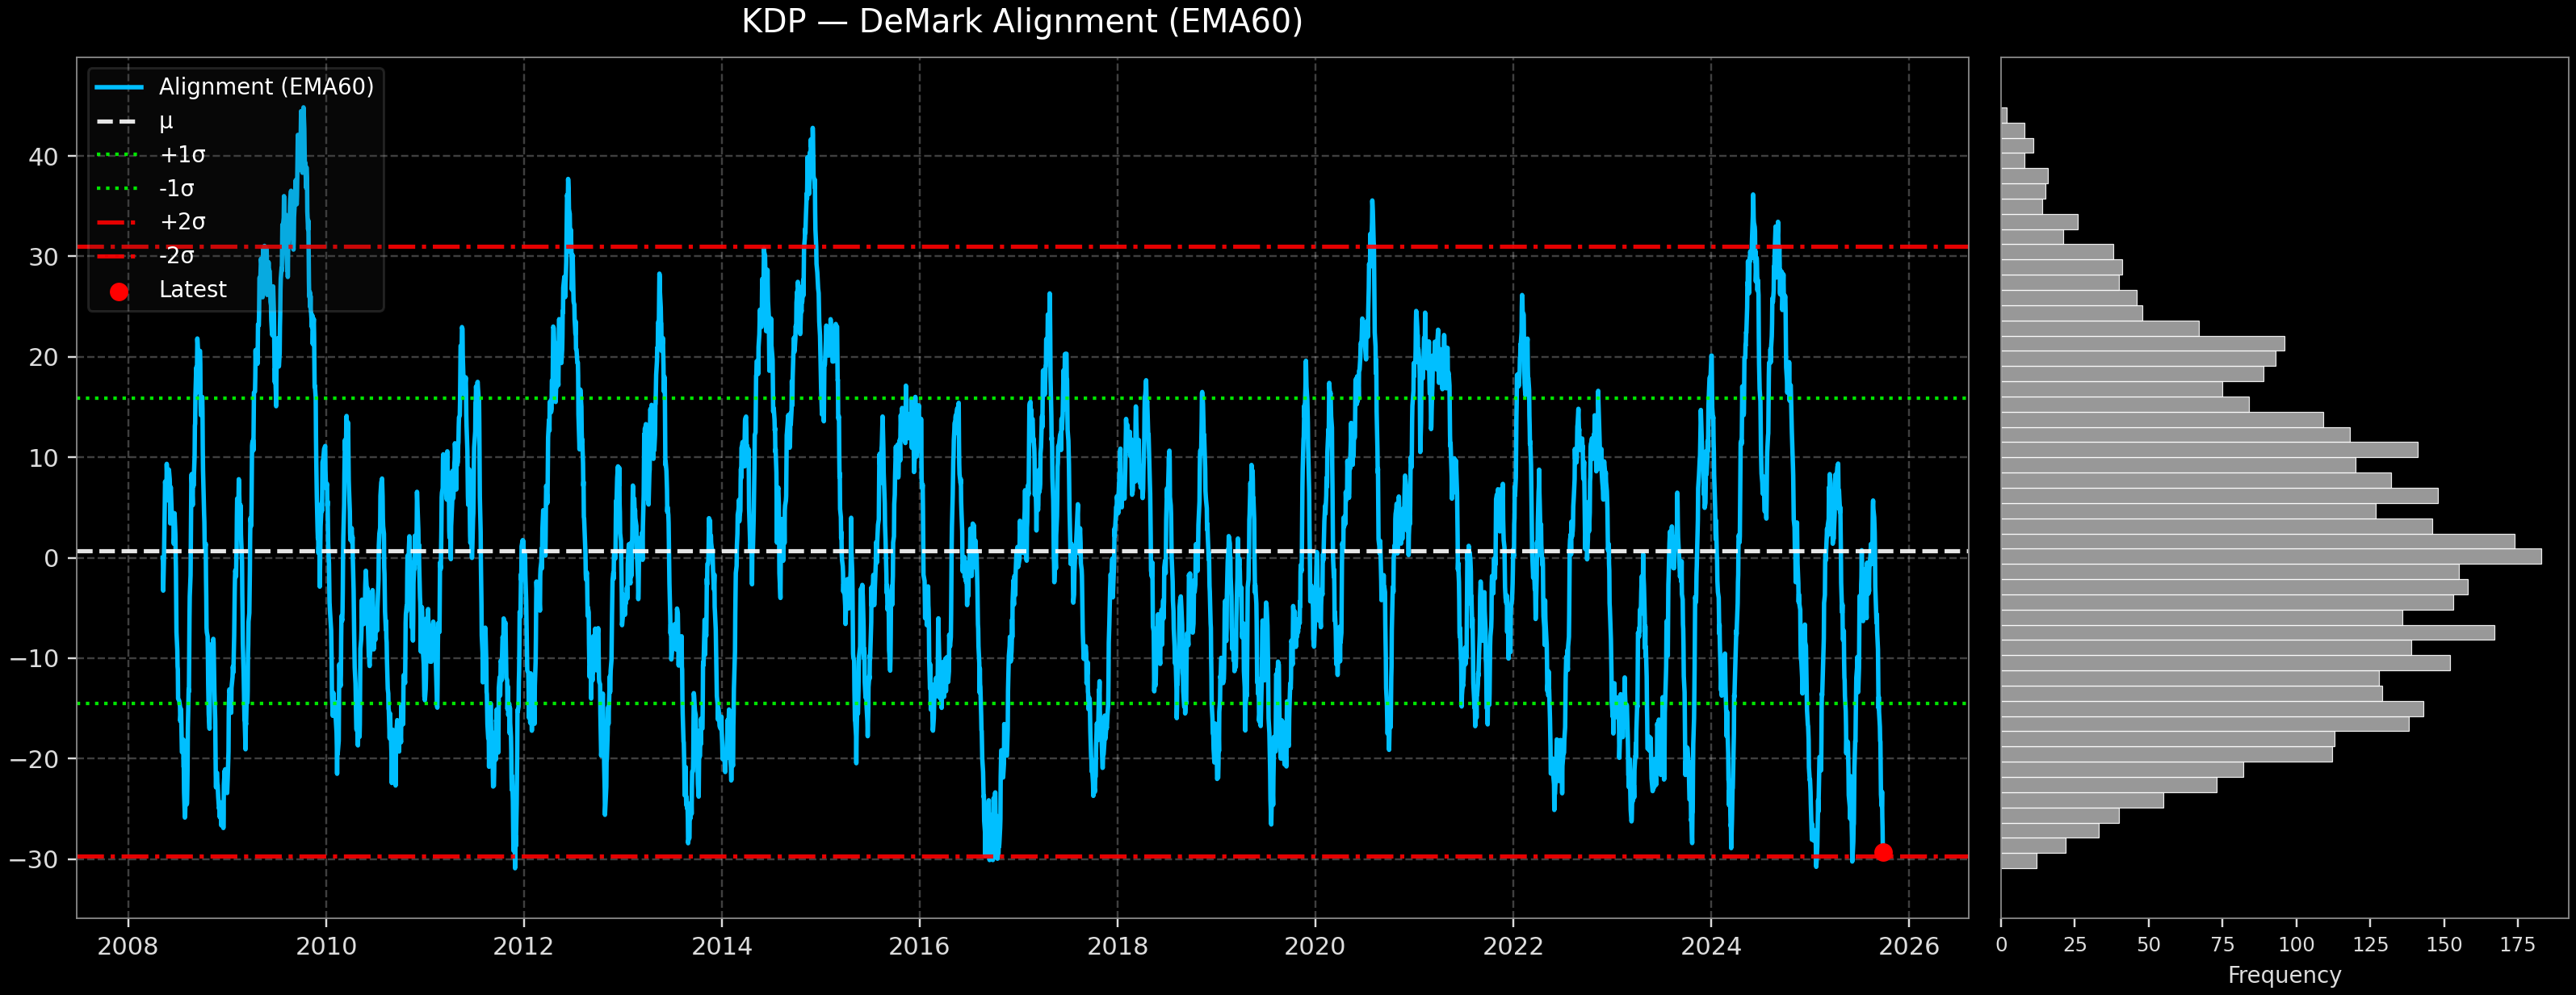
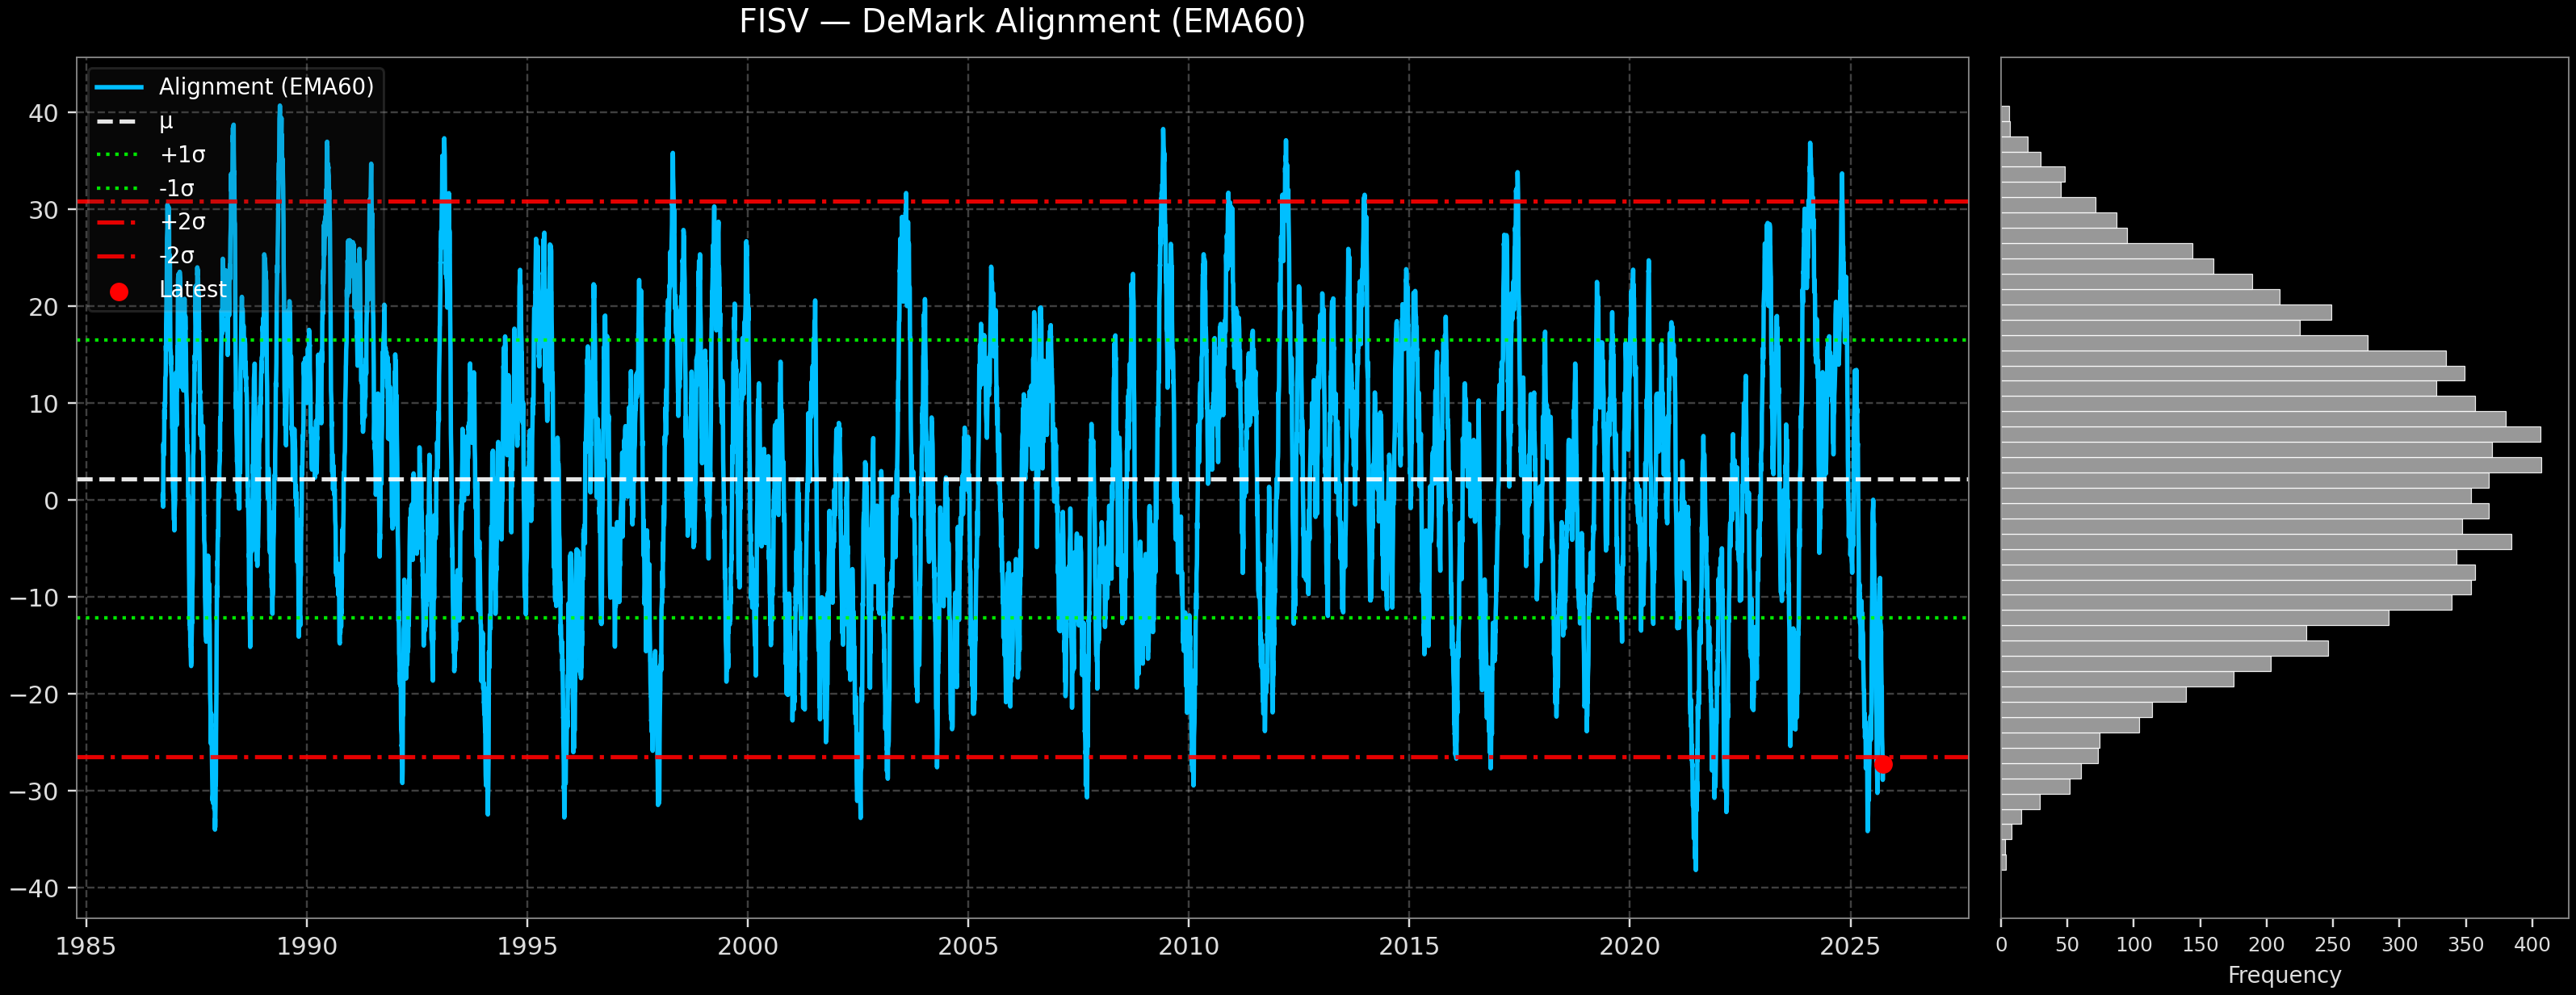
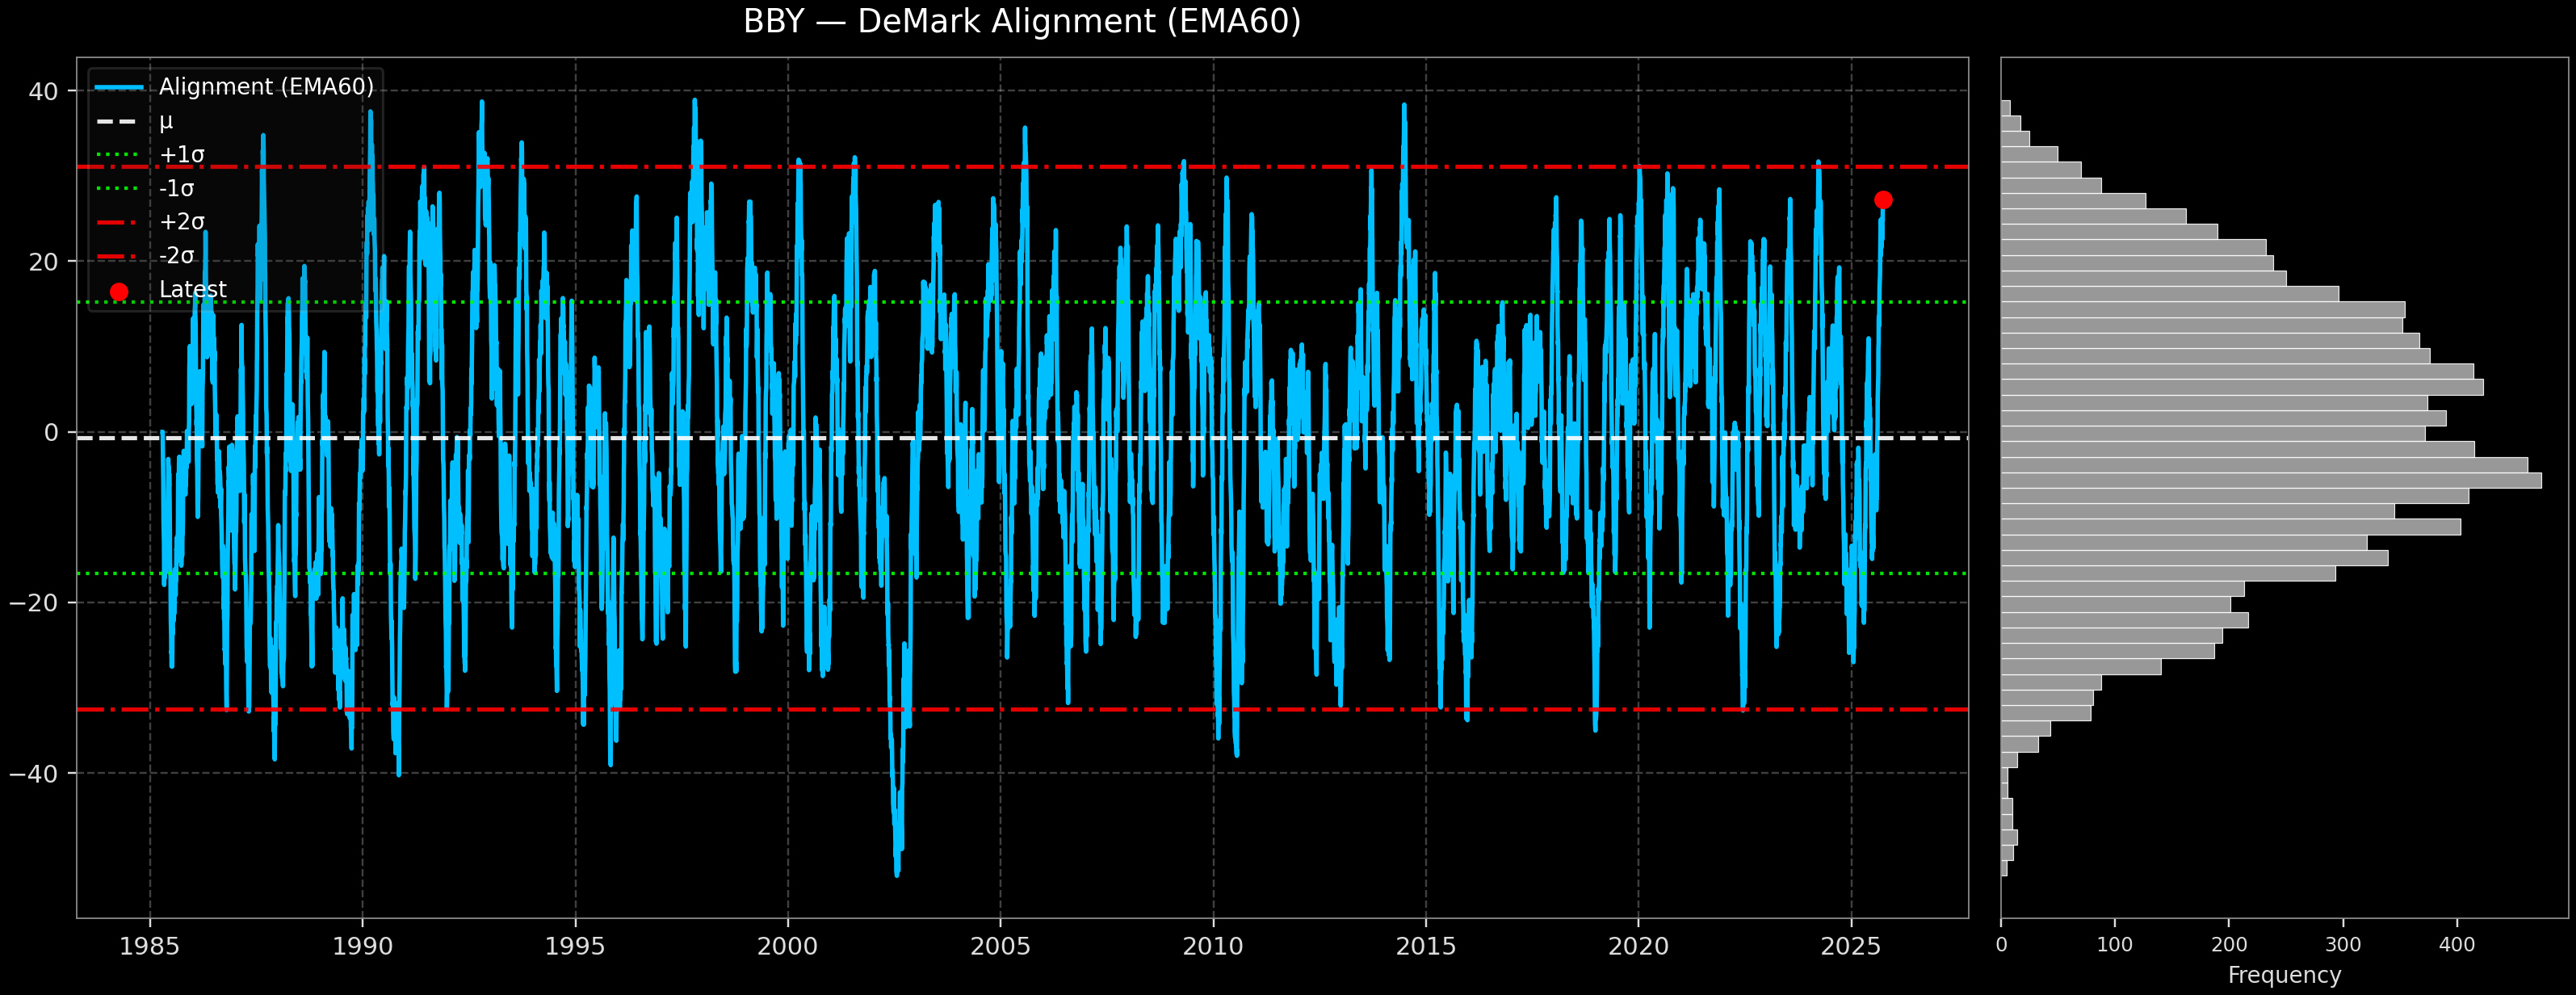
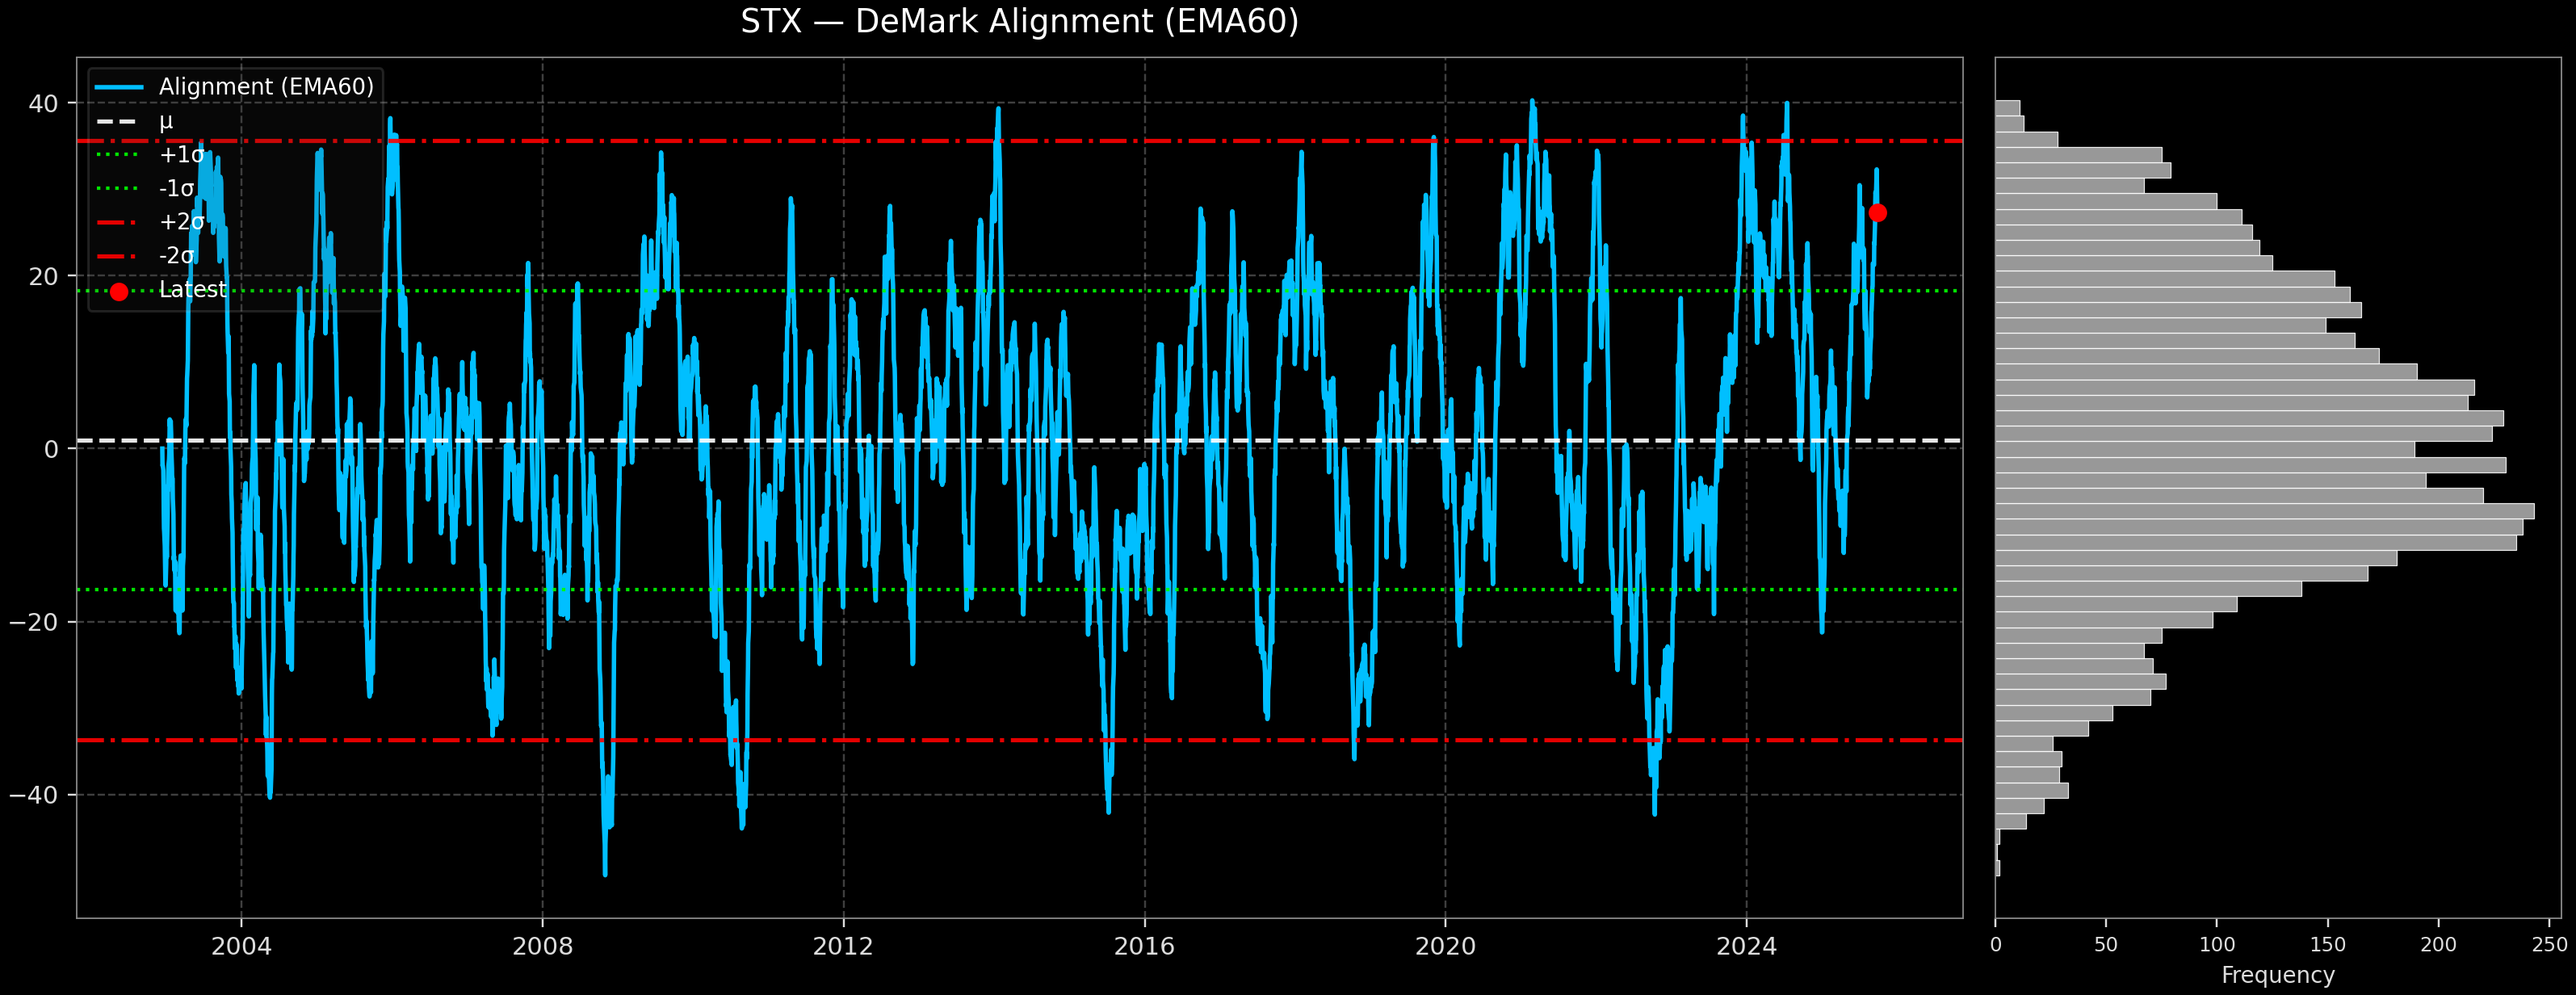
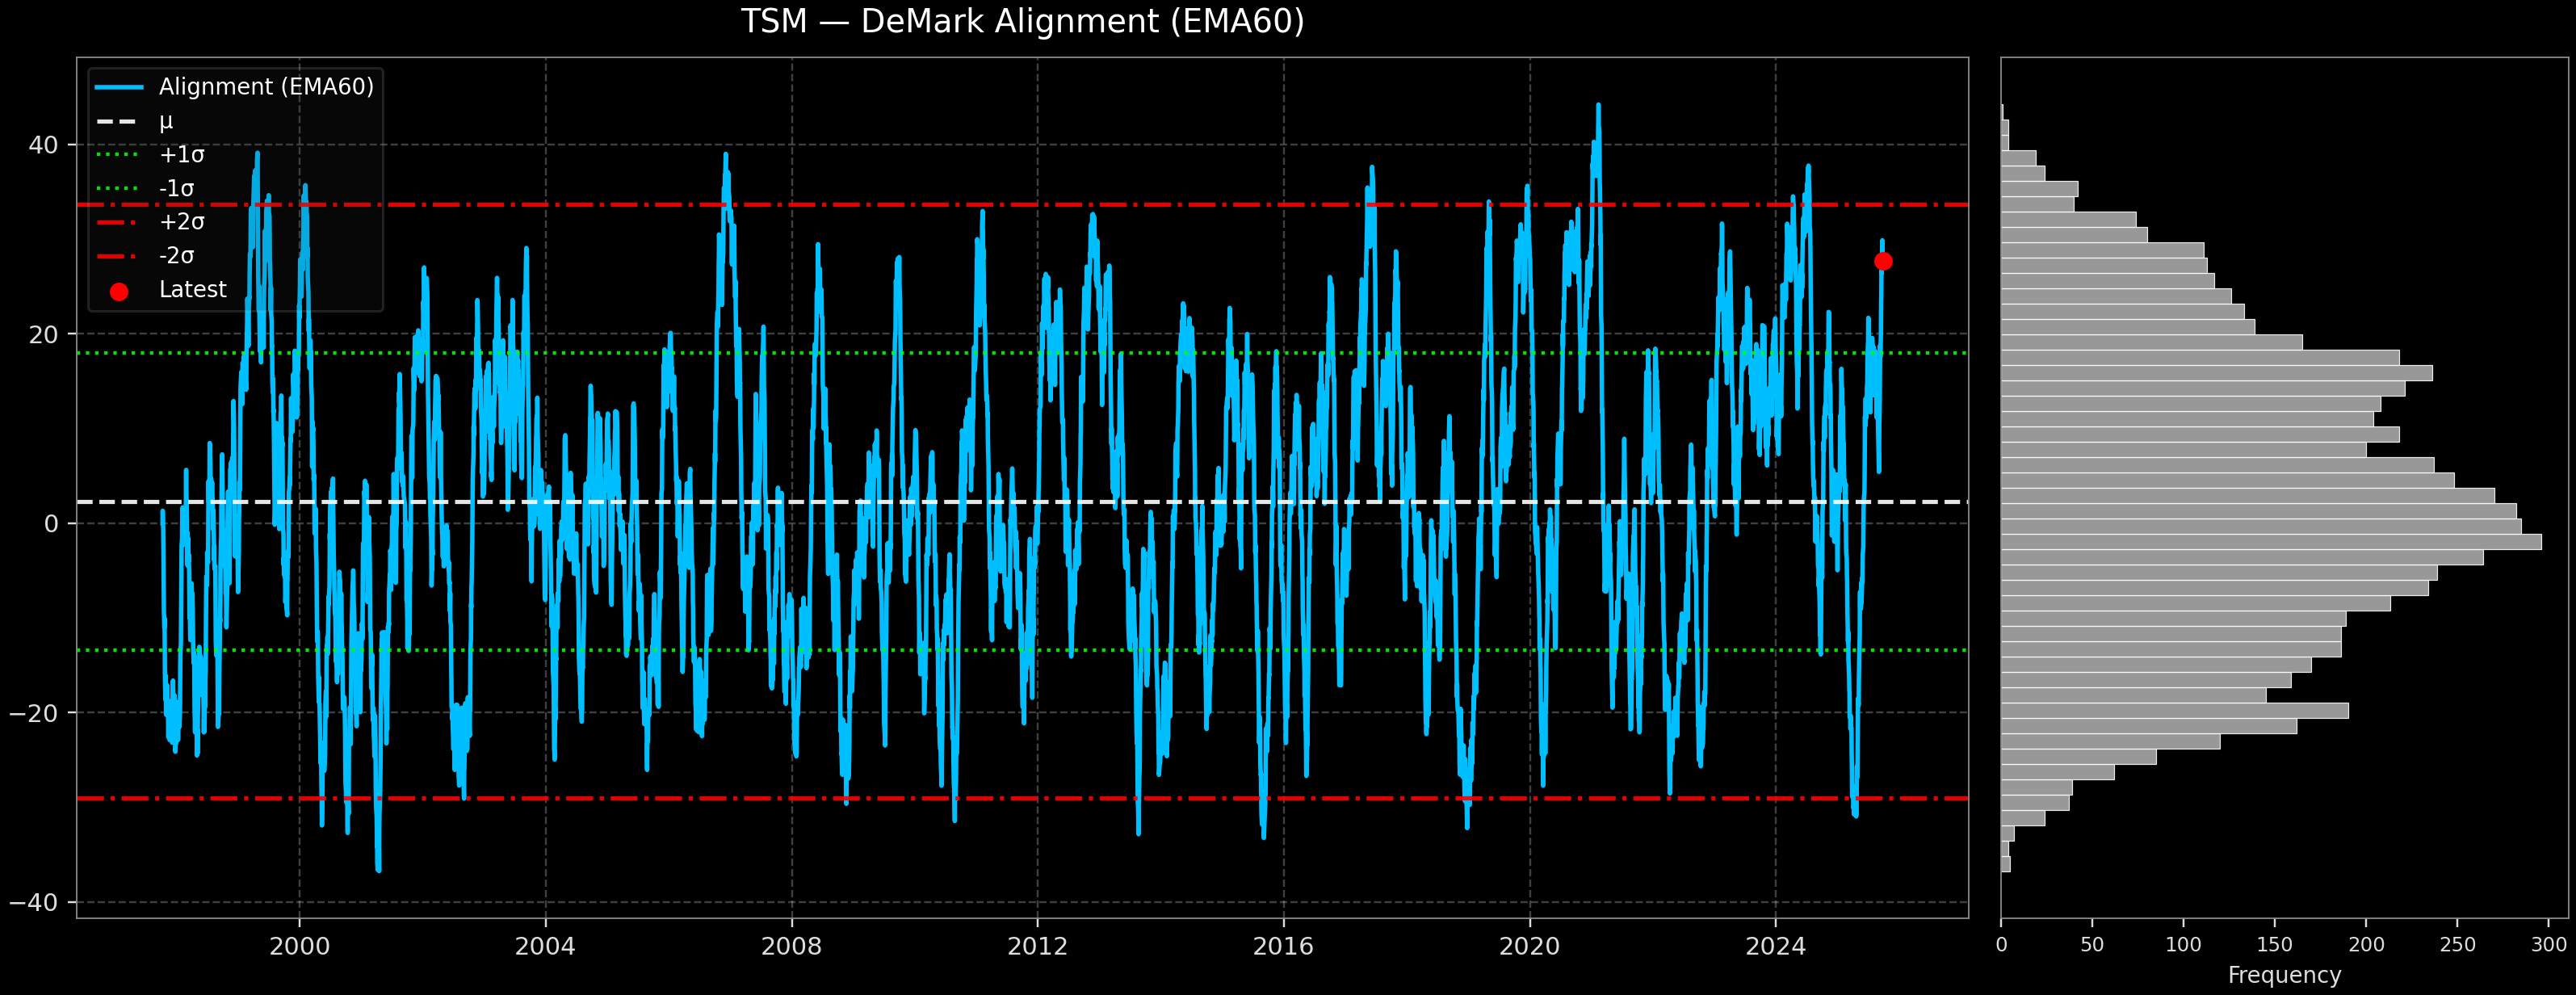
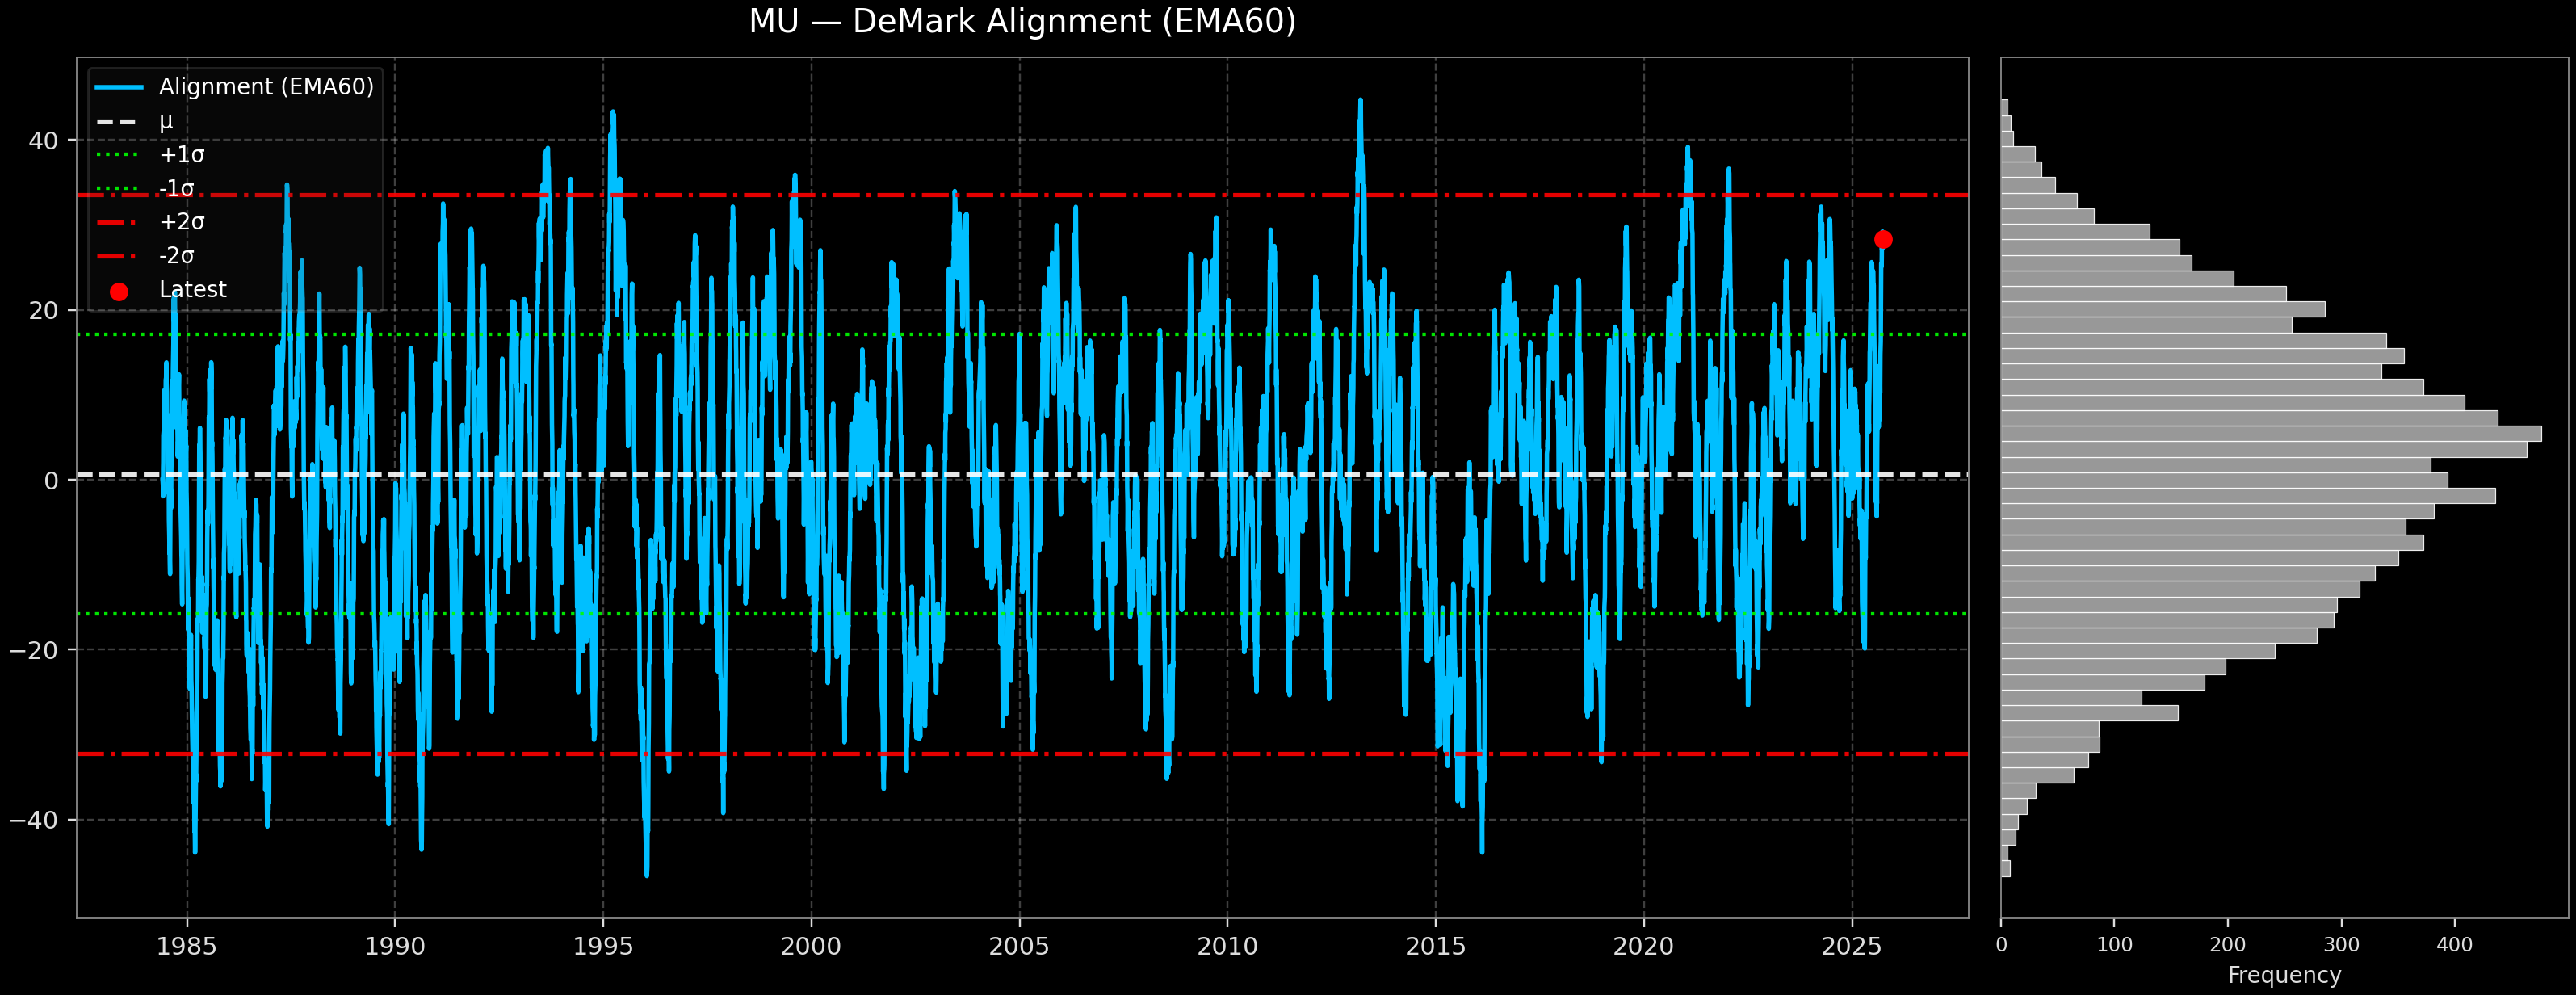
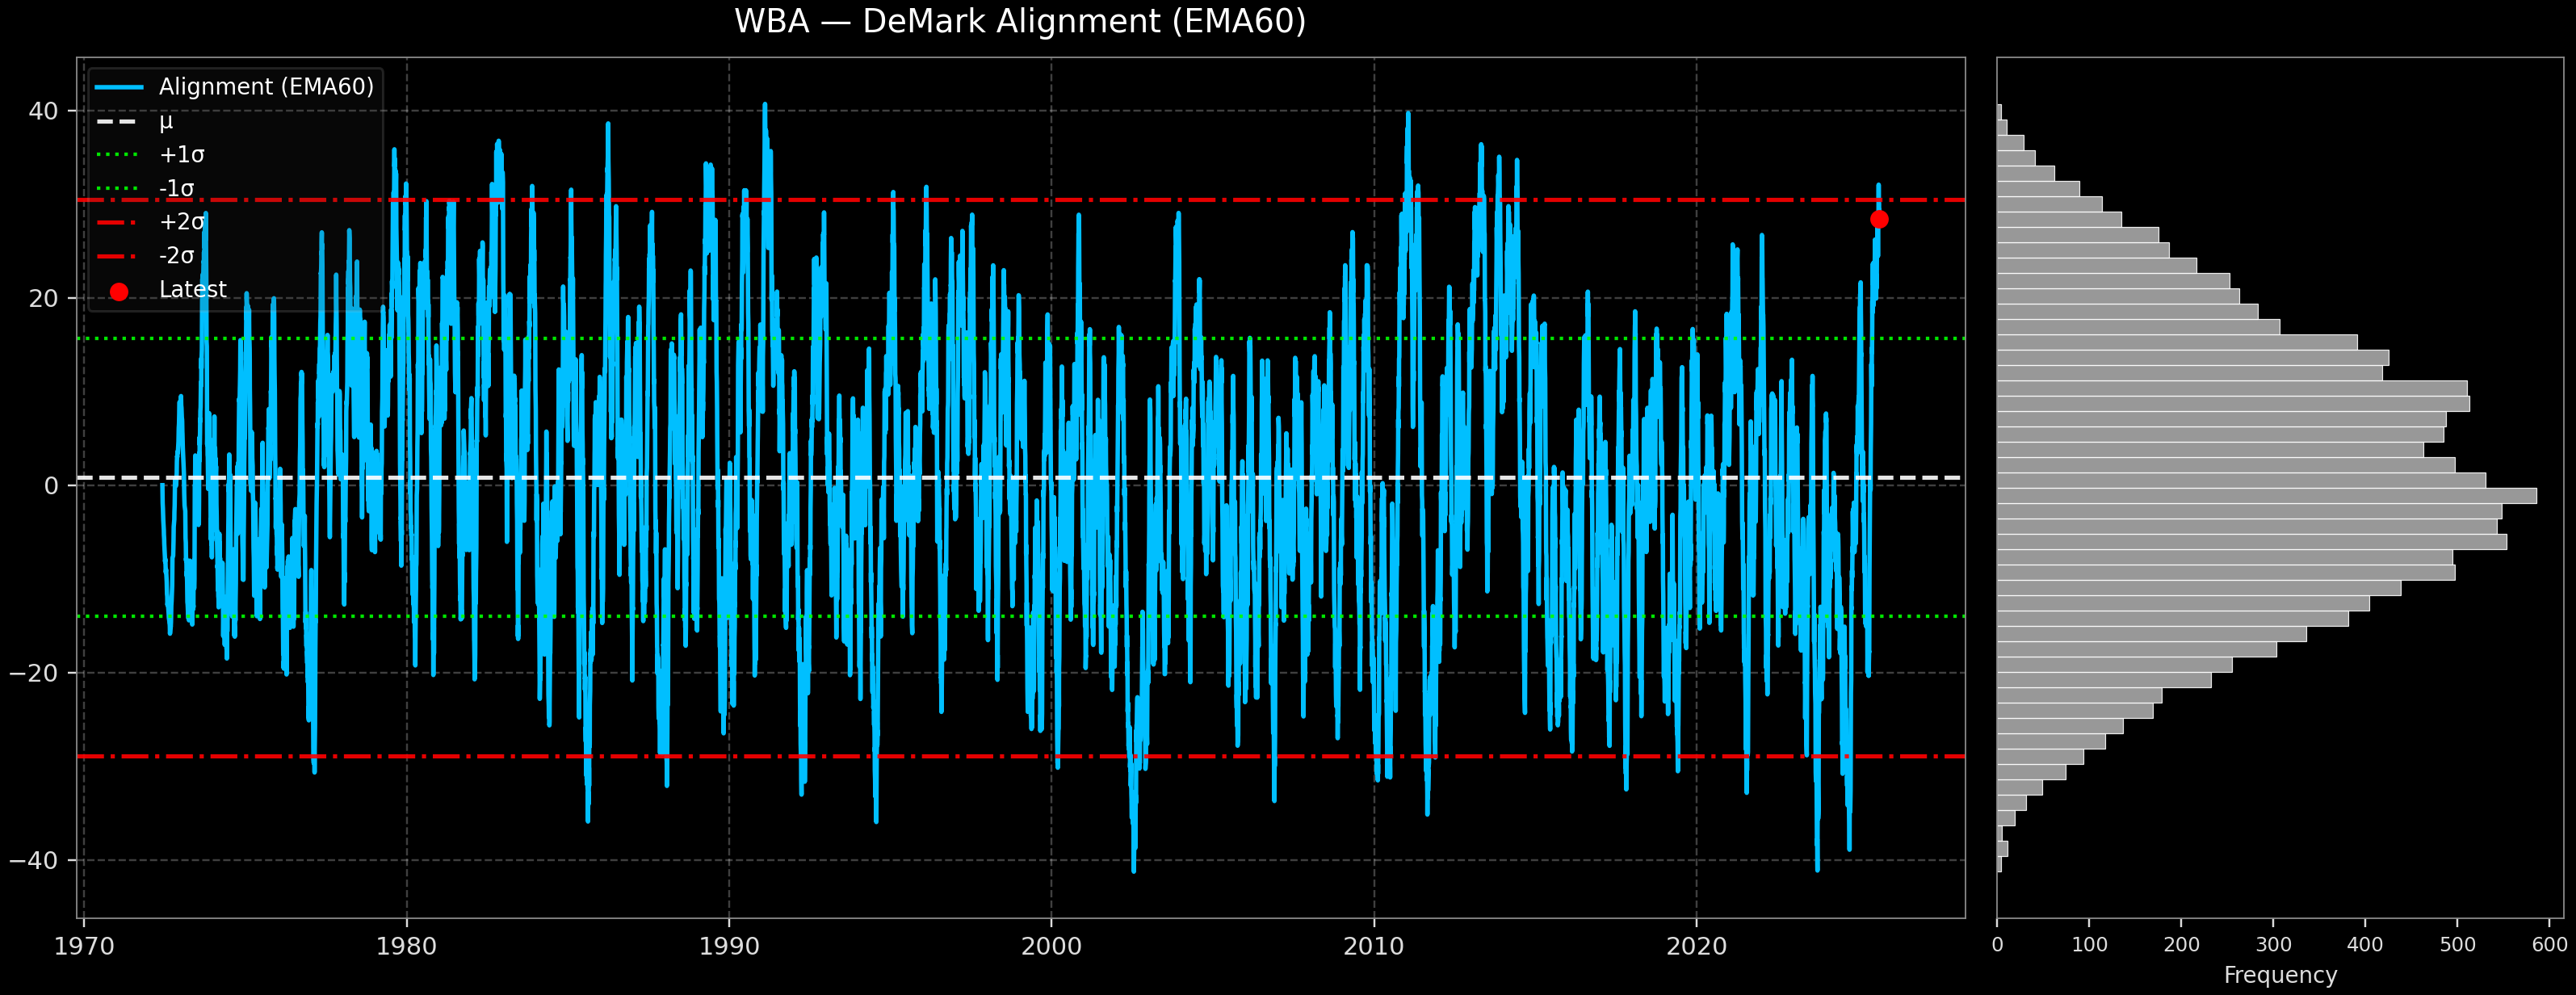
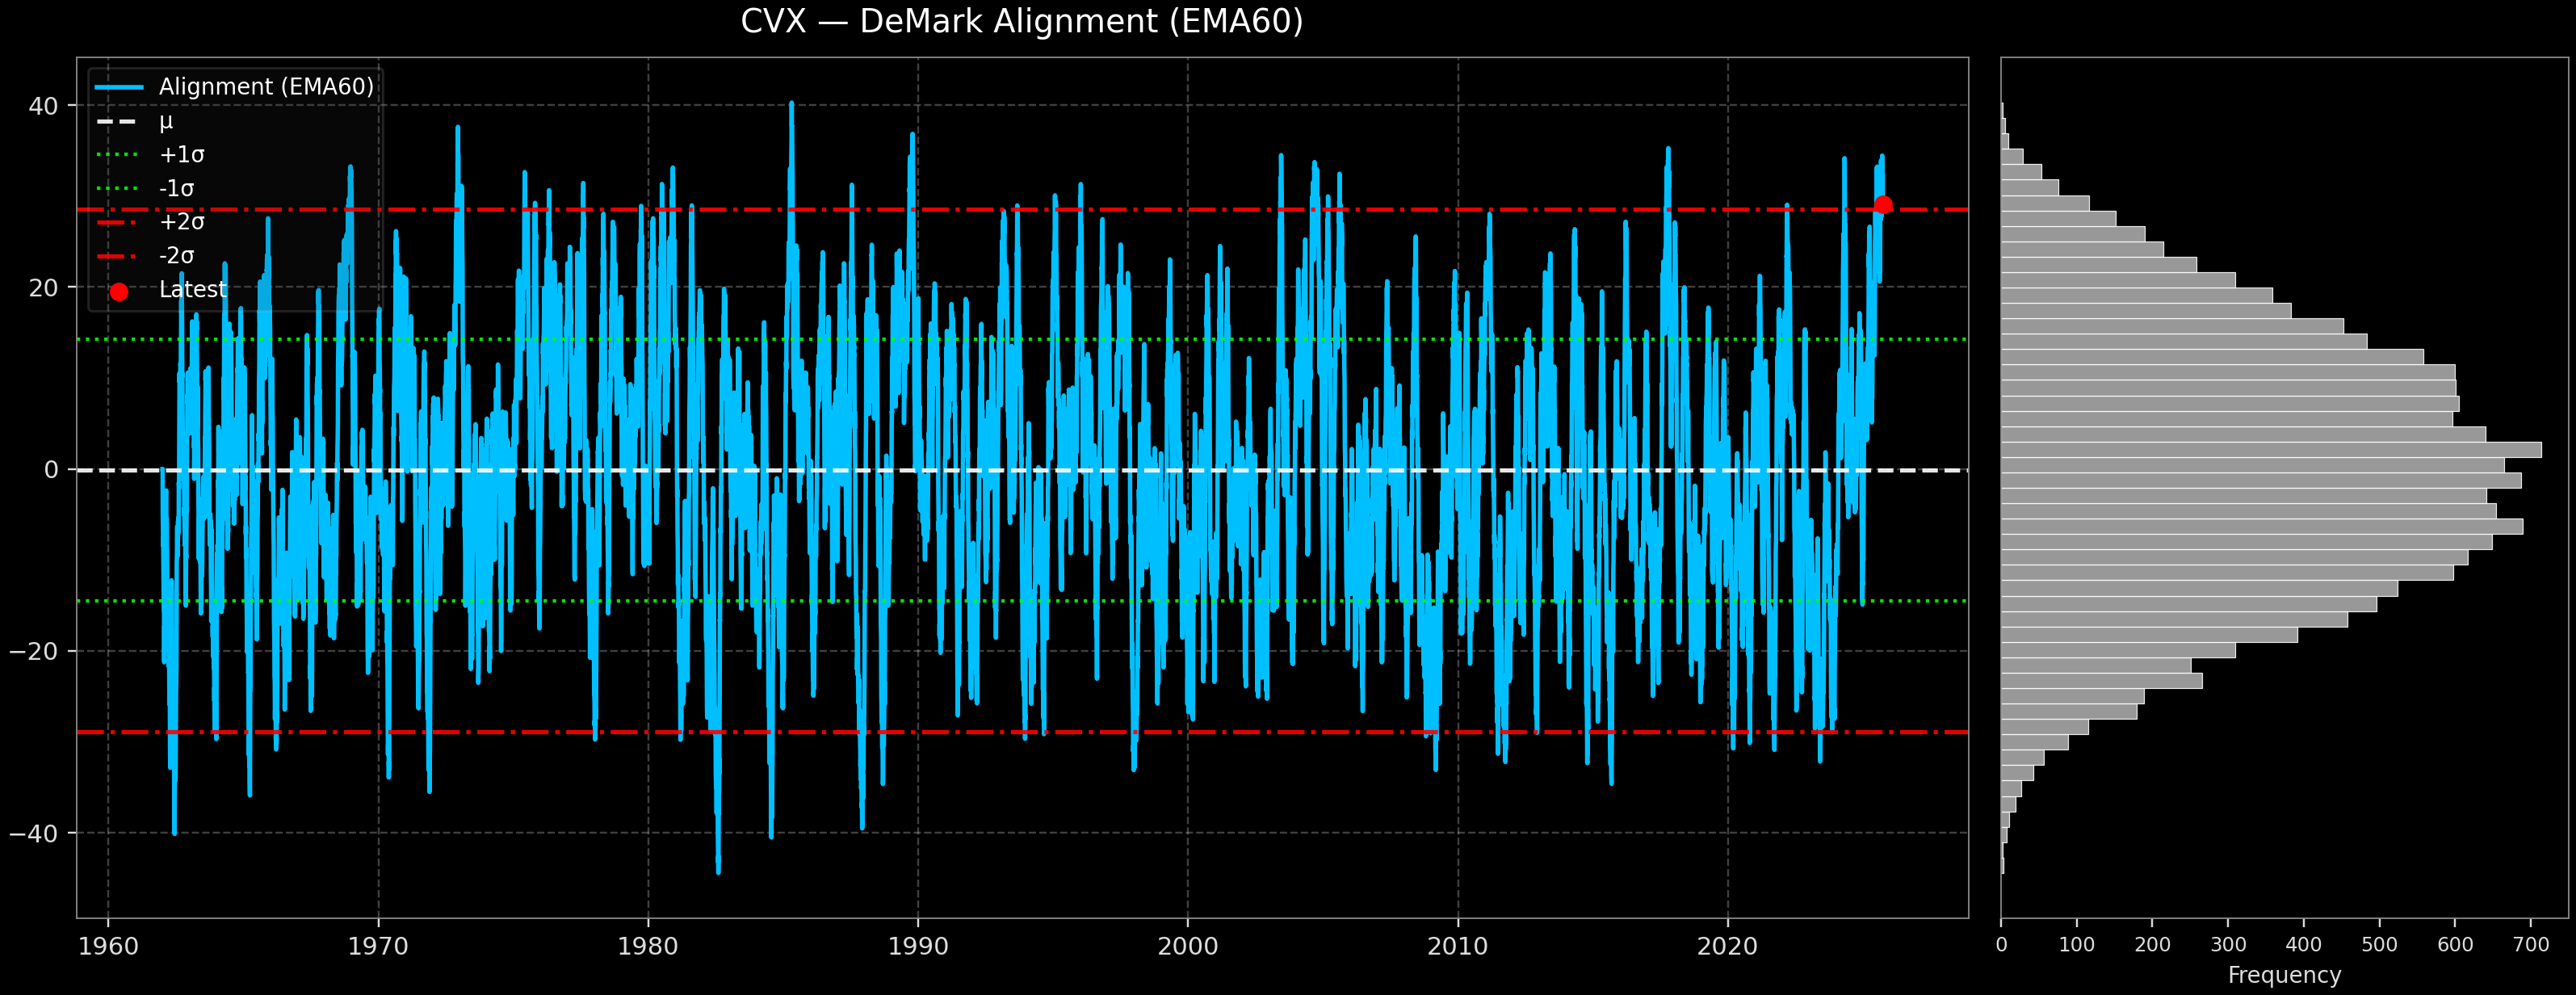
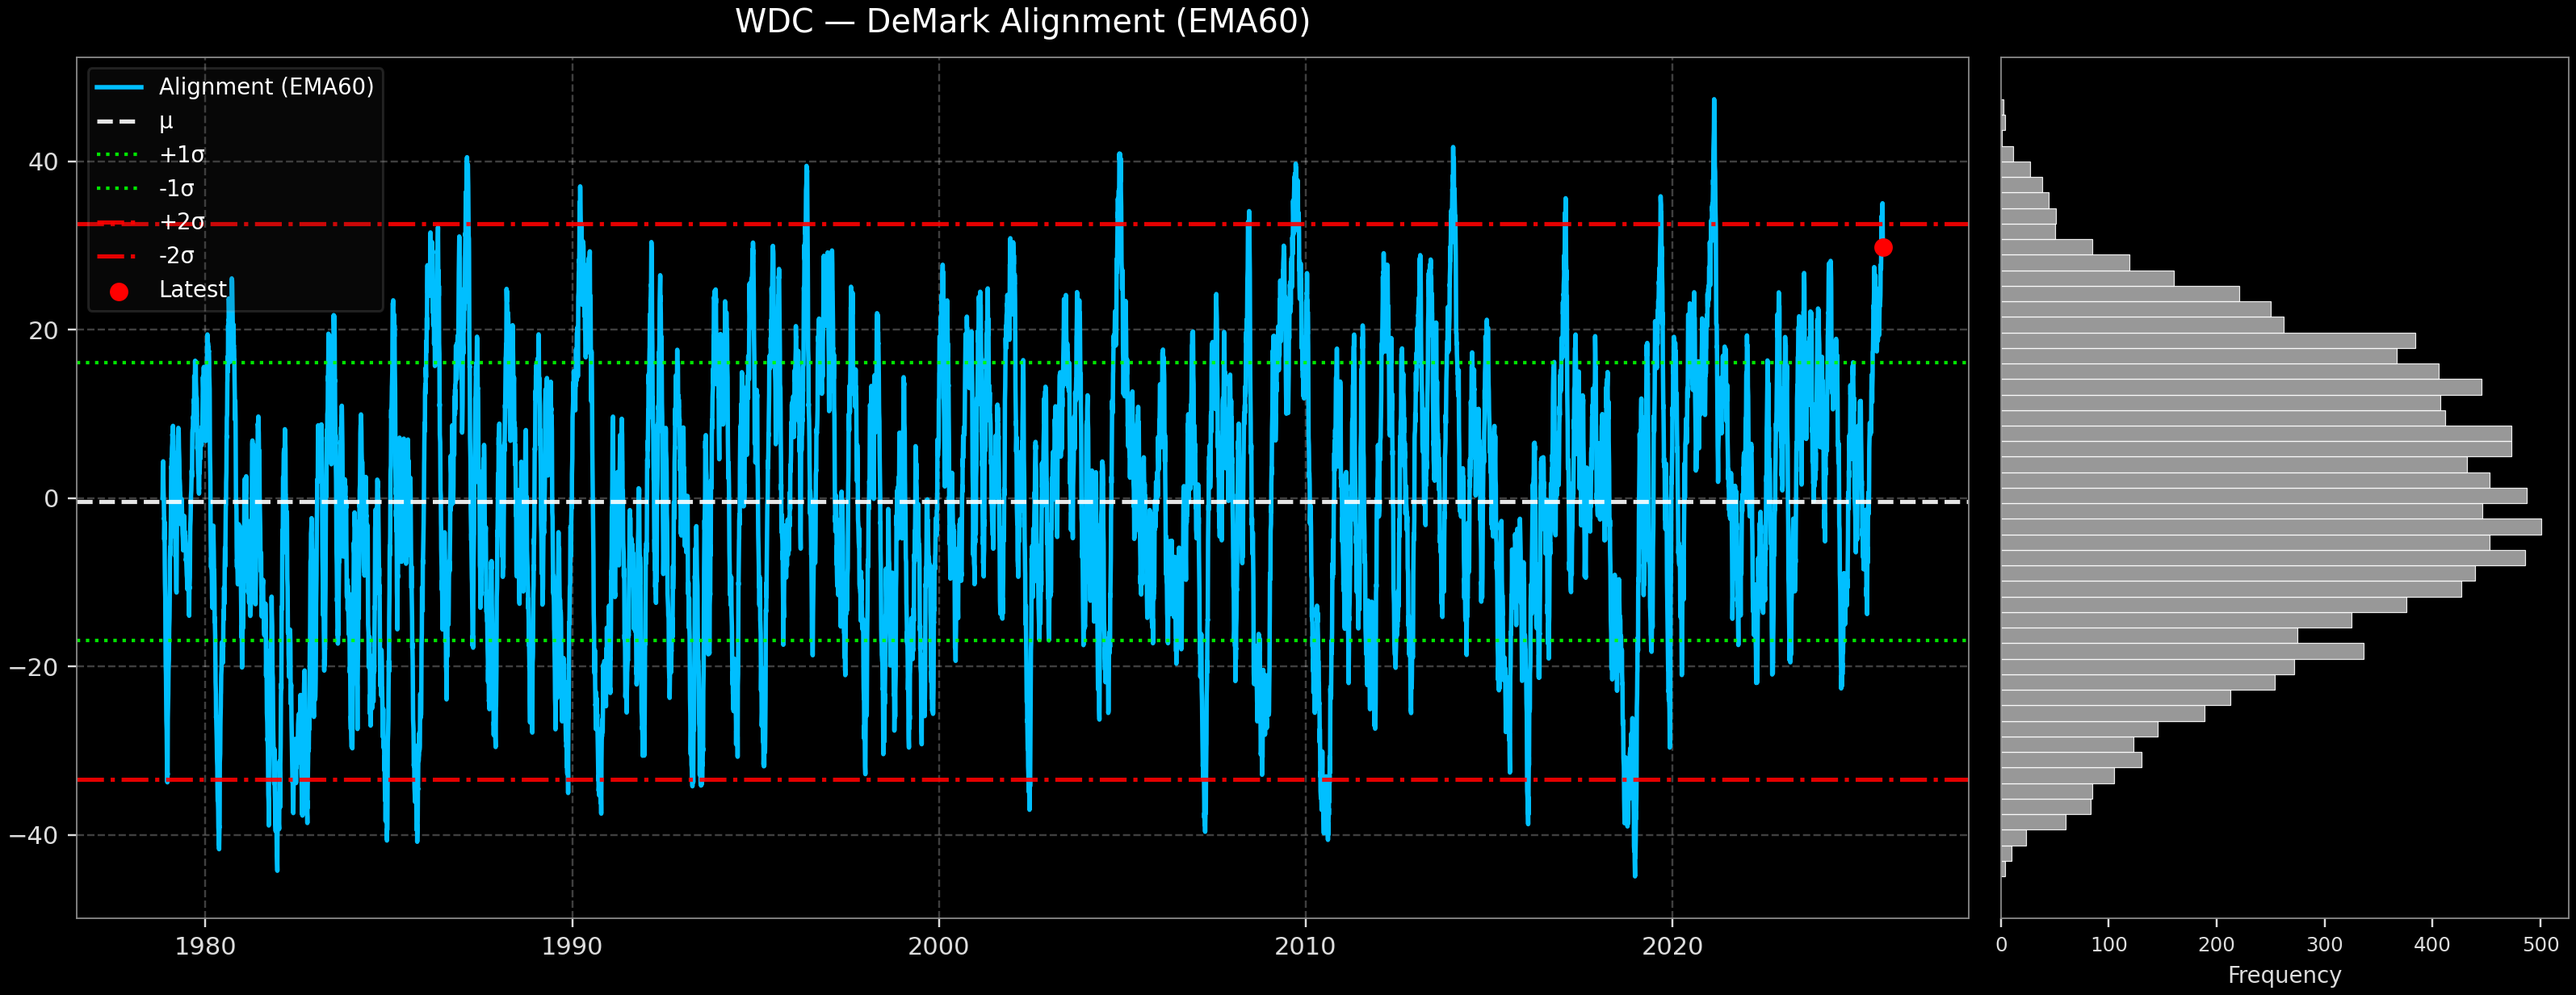
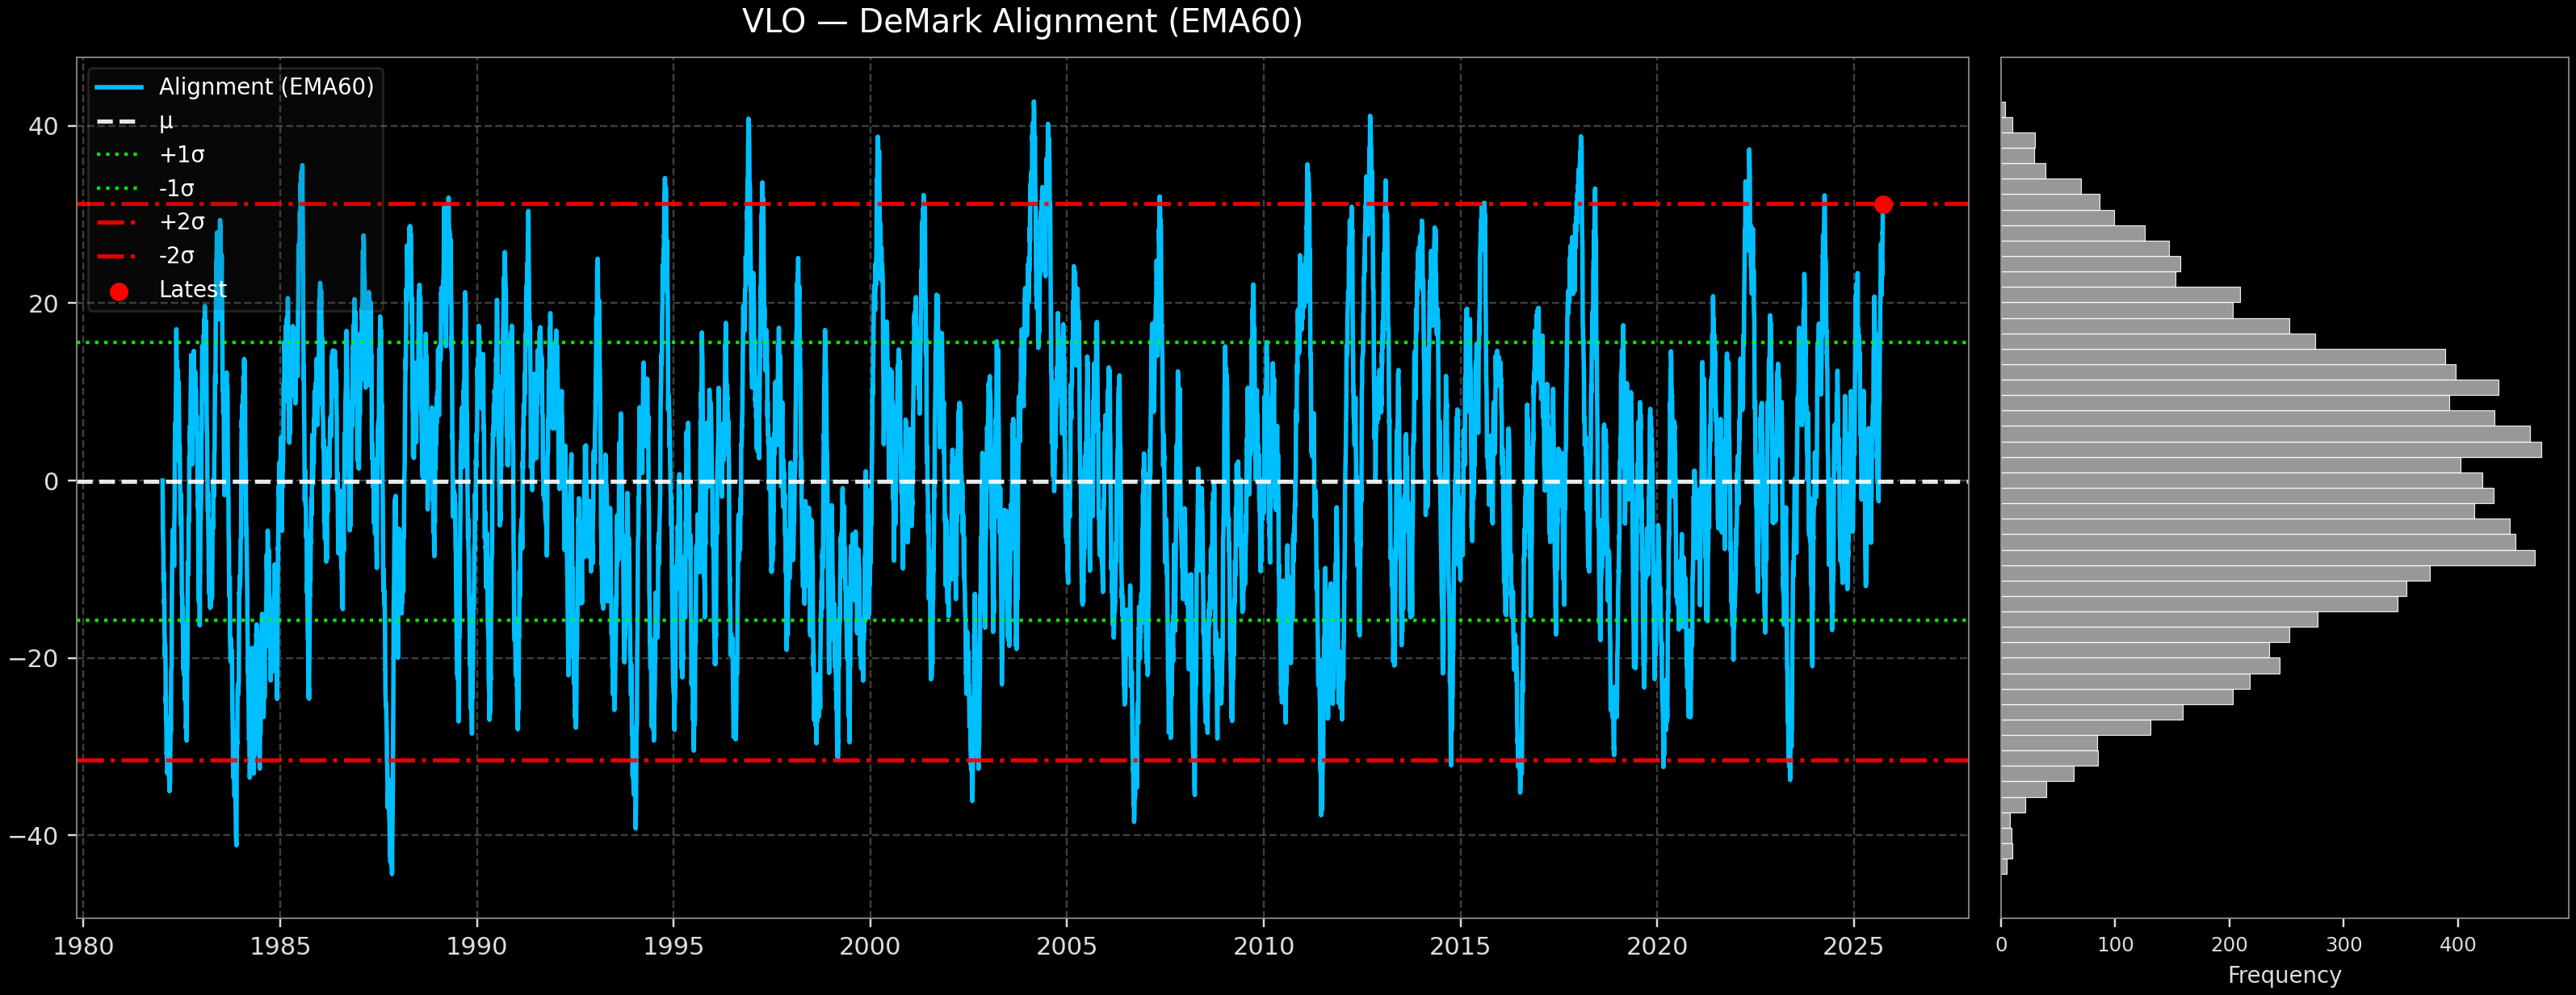
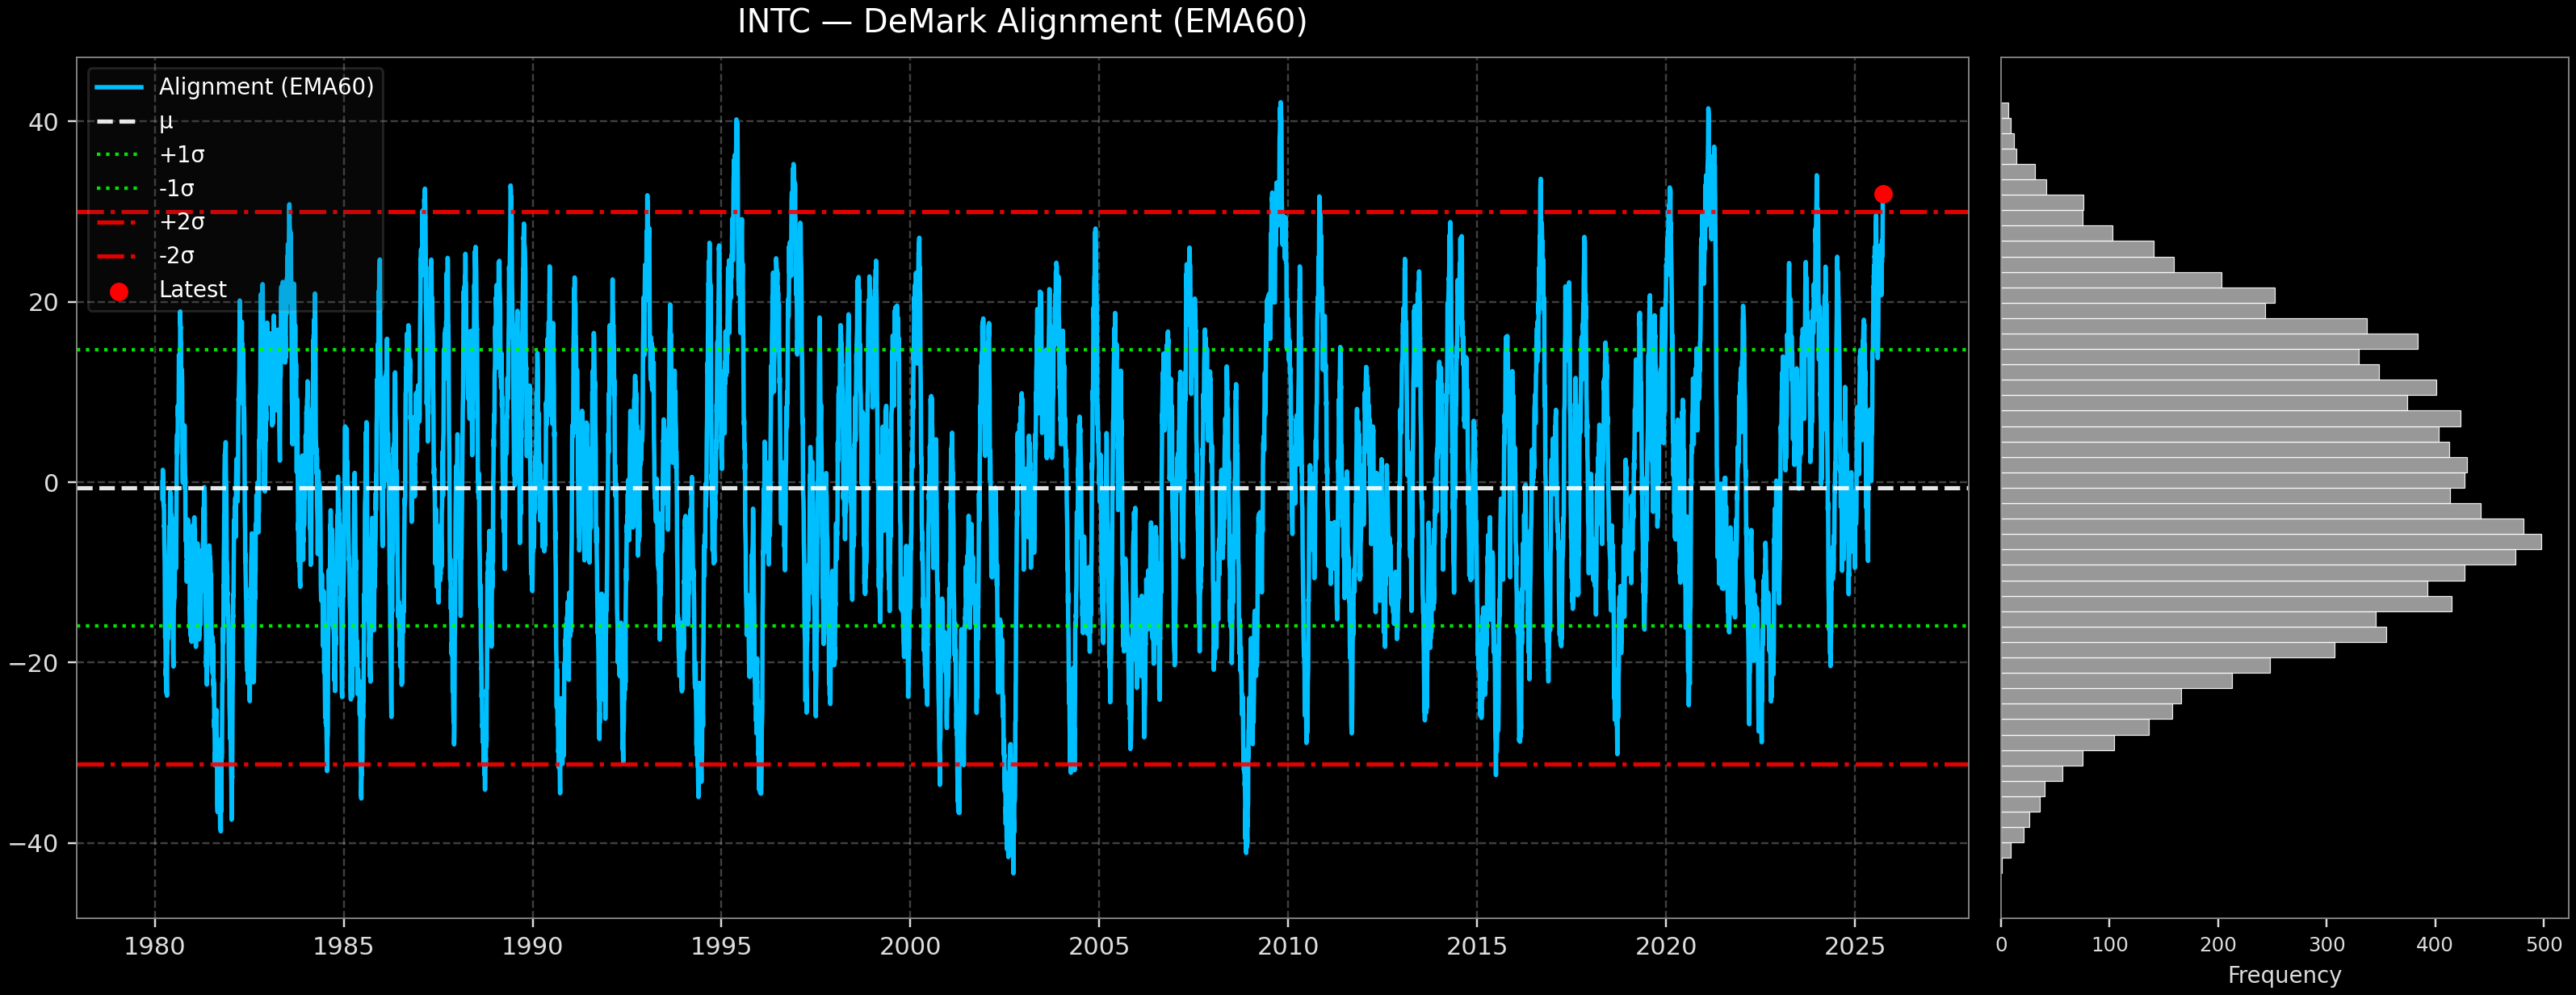
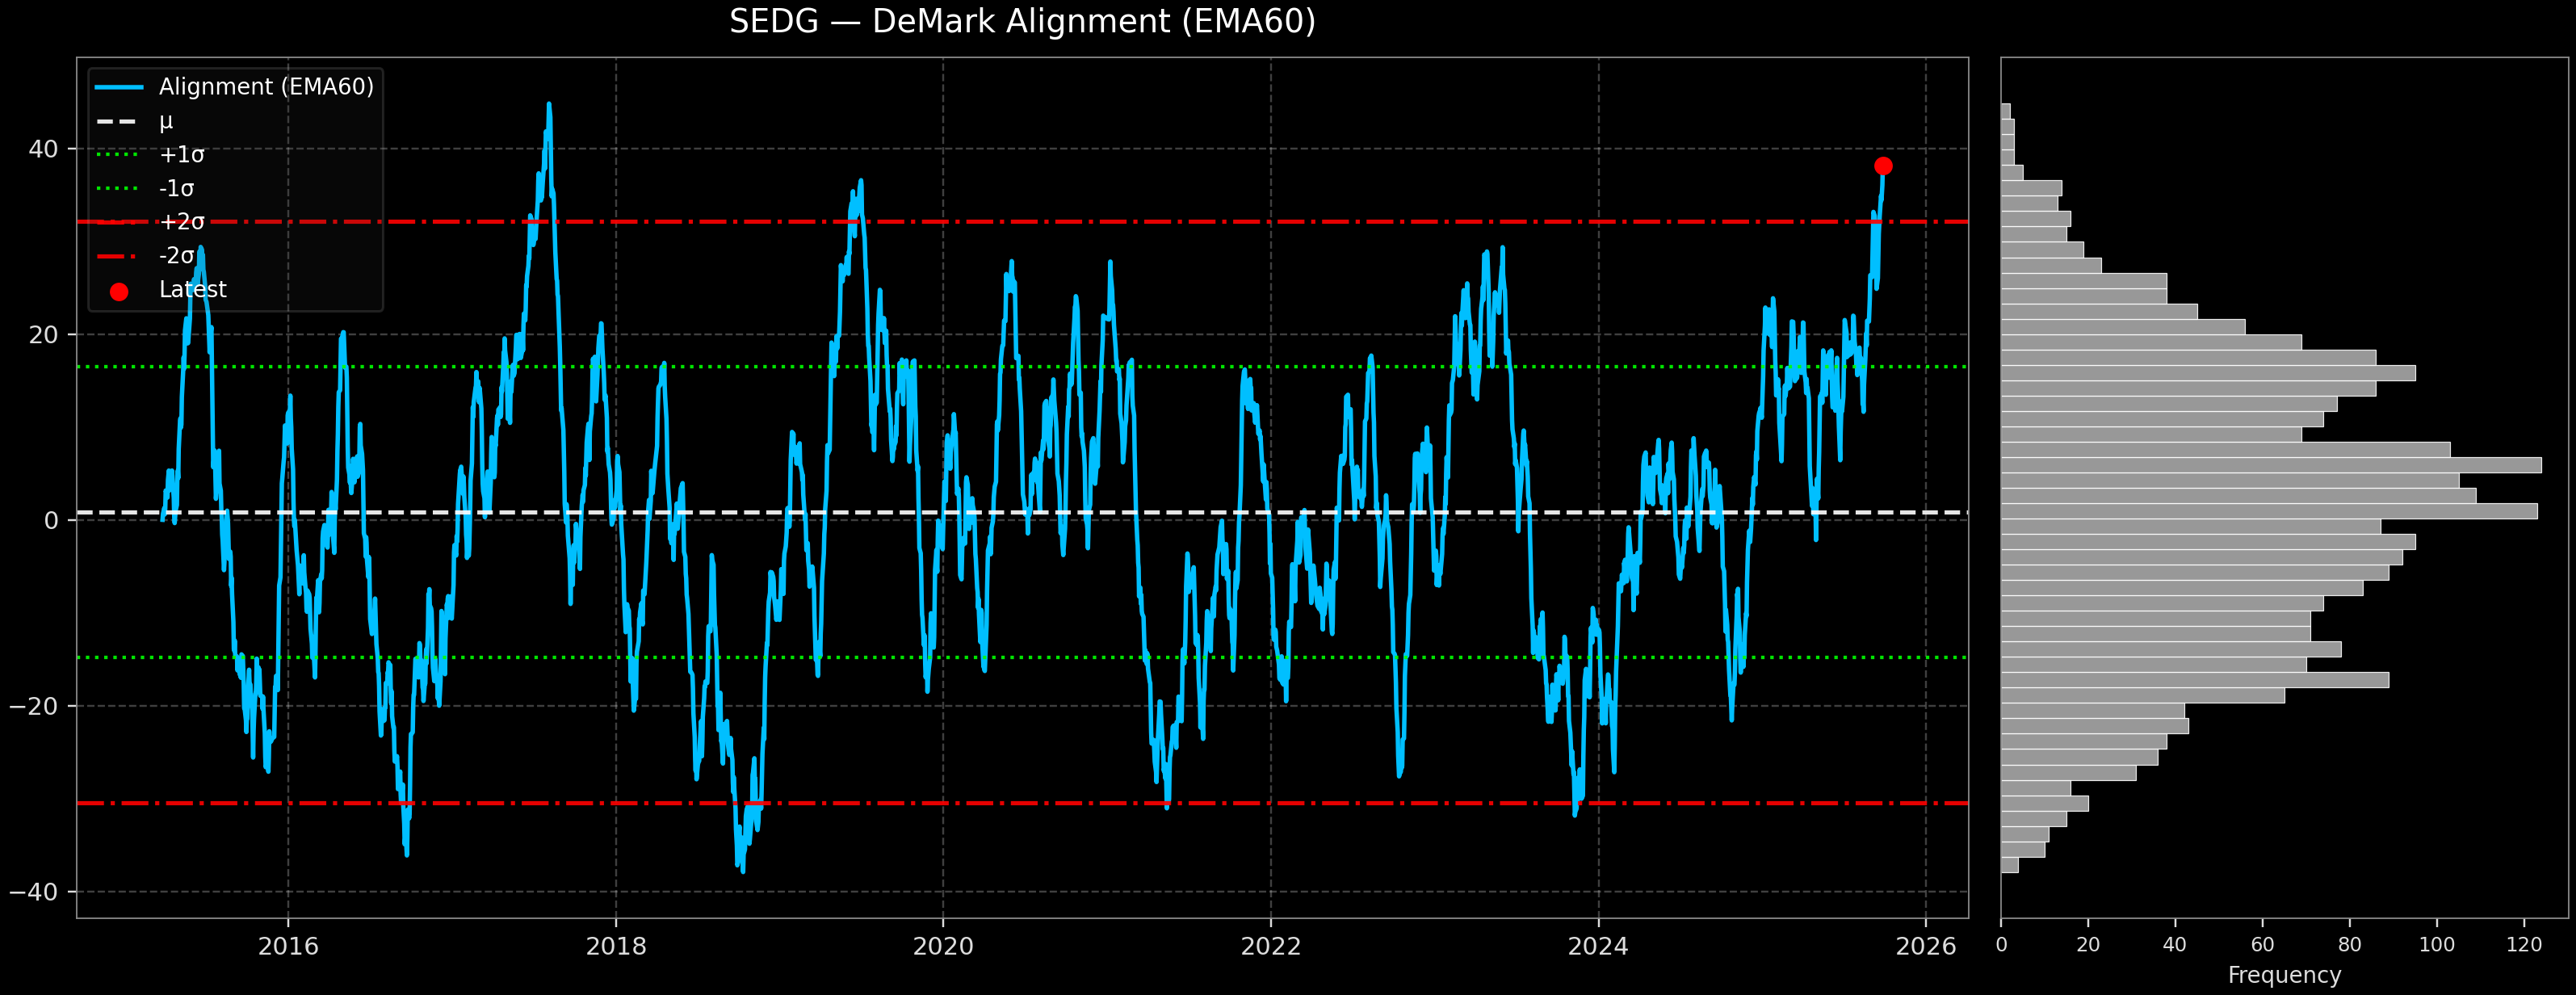
Today’s DeMark Diffusion™ – S&P 500 Top & Bottom 10 highlights the most extended and most depressed names versus their own history using a composite alignment signal. The opening chart ranks the selected 20 by their latest reading; bodies show mean ±1σ while wicks capture the historical min–max, with a red diamond marking today and a hollow yellow dot marking ~1 week ago. Subsequent panels show each name’s time series and distribution so you can quickly judge if it’s stretched, neutral, or depressed.