Market Dashboard
Last Updated: April 09, 2026
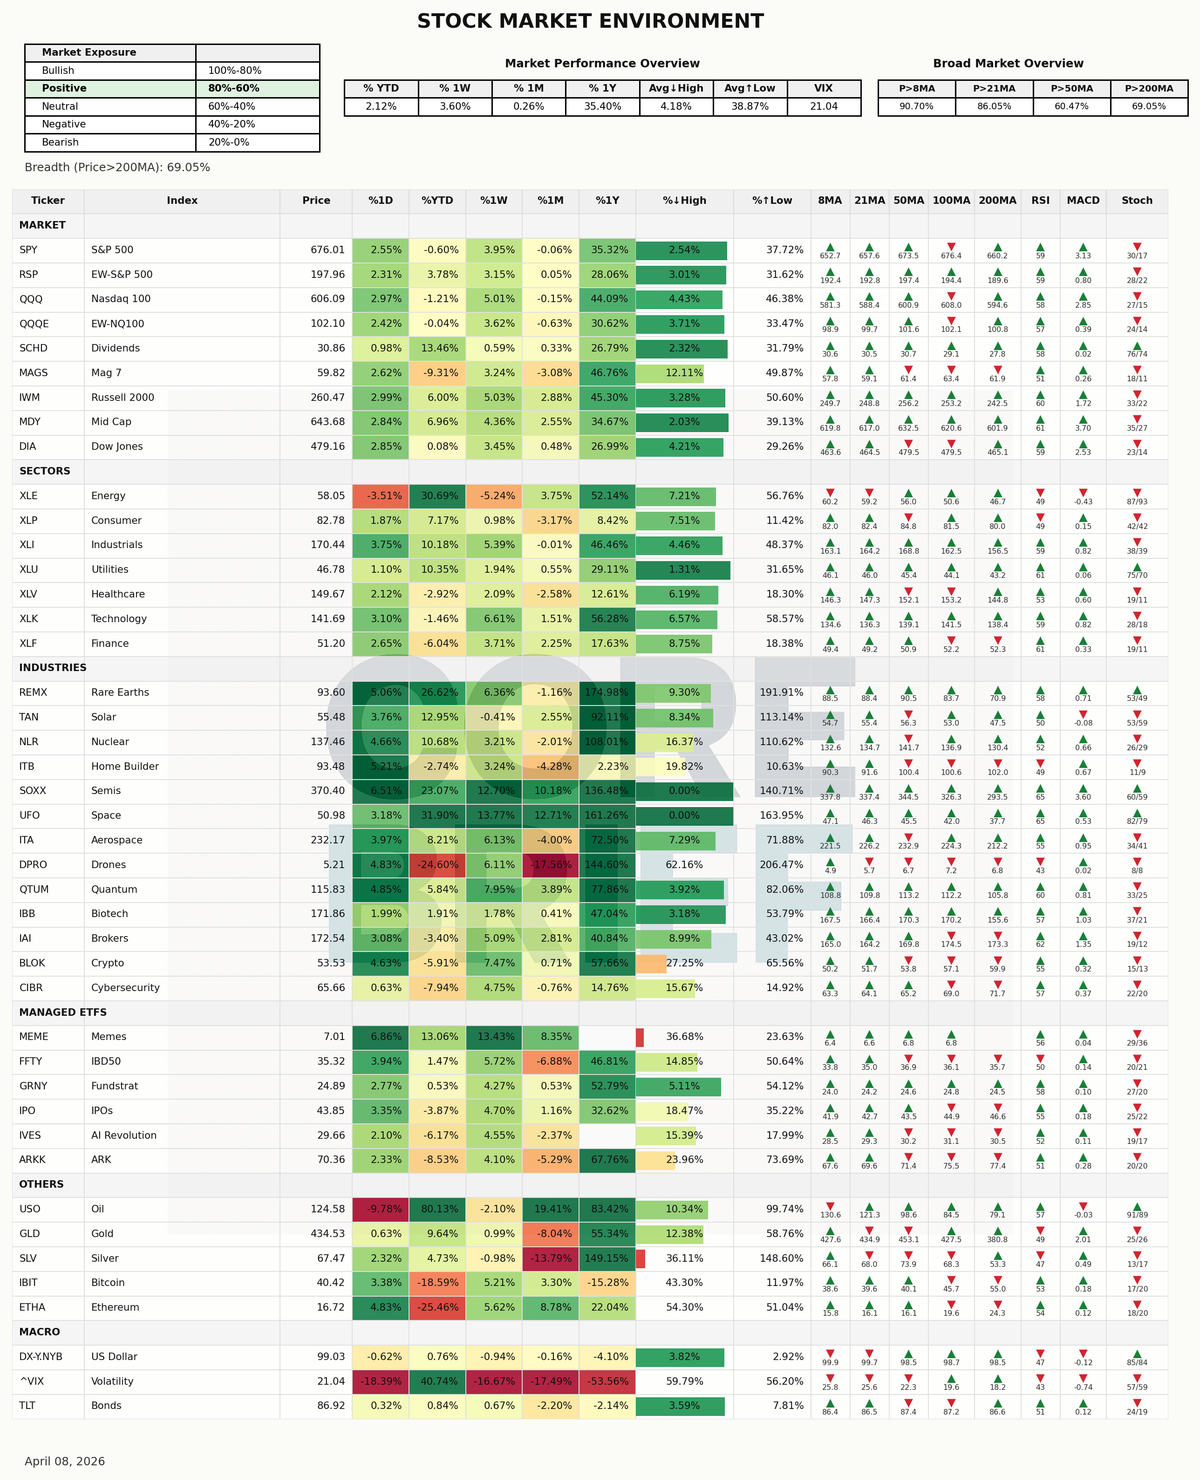
The current market breadth is characterized by a positive trend, with 69.0% of stocks holding above their 200-day moving average, indicating a degree of strength in the overall market sentiment.
Among the notable movers, MEME led the gainers with a 6.9% increase, followed by SOXX at 6.5% and ITB at 5.2%. On the other hand, USO was the largest loser, declining by 9.8%, accompanied by XLE at -3.5% and TLT at 0.3%.
The broad market average YTD stands at 2.12%, suggesting a modest upward trend. With the VIX at 21.04, it indicates a level of fear that is higher than the complacency threshold of 15 but lower than the elevated fear threshold of 25. This creates a tension between the relatively healthy breadth data and the VIX reading, as the market's ability to sustain its current rally appears to be at odds with the lingering fear reflected in the VIX.