Market Dashboard
Last Updated: July 09, 2026
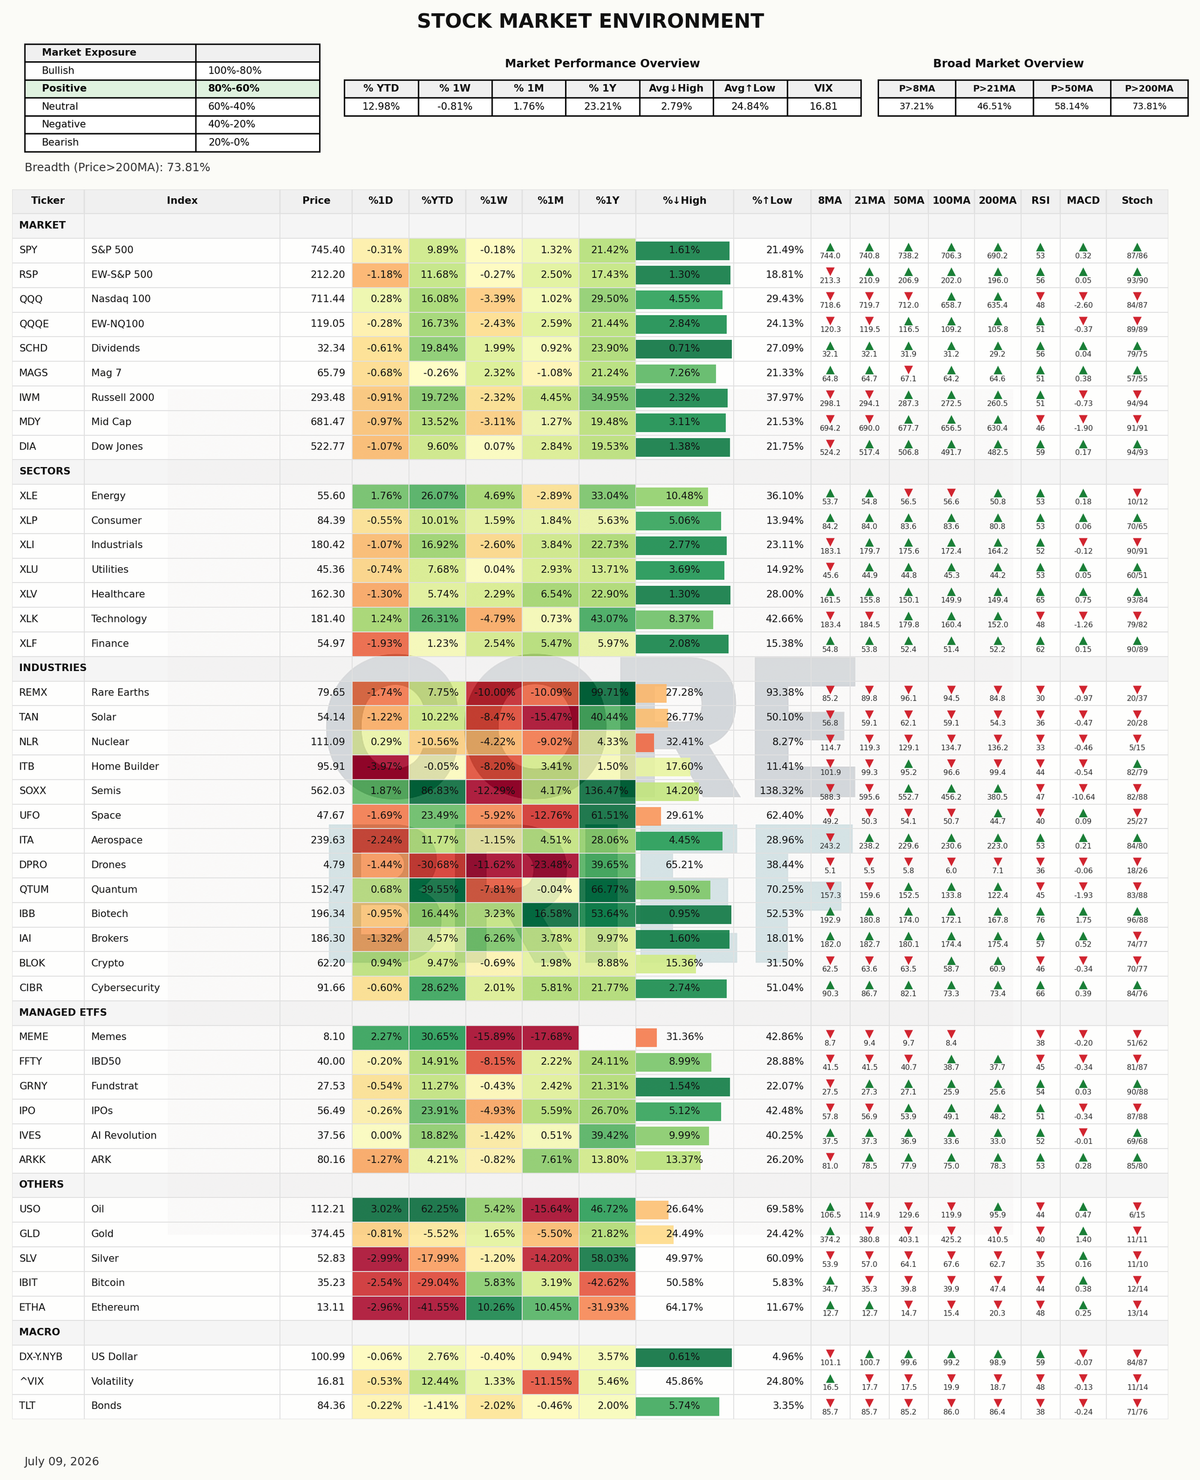
The current market breadth is characterized by a positive label, with 73.8% of broad markets trading above their 200-day moving average, indicating a strong trend.
Among the notable movers, USO led the gainers with a 3.0% increase, followed by MEME and SOXX, which rose by 2.3% and 1.9%, respectively. On the other hand, ETHA, SLV, and ITB were the top losers, declining by 3.0%, 3.0%, and 4.0%, respectively.
The broad market average YTD stands at 12.98%, suggesting a healthy trend. The VIX level of 16.81 implies a state of moderate fear, as it is above the complacency threshold of 15. However, the coexistence of a high breadth percentage and a relatively low VIX reading creates a divergence, as one would expect a higher VIX level to accompany a strong market uptrend, or vice versa.