Earnings
Core-Brief


DeMark Diffusion™ - STOXX Europe 600 Top & Bottom 10 - 2026-02-06
Today’s DeMark Diffusion™ – STOXX Europe 600 Top & Bottom 10 highlights the most extended and most depressed names versus their own history using a composite alignment signal. The opening chart ranks the selected 20 by their latest reading; bodies show mean ±1σ while wicks capture the historical min–max,
DeMark Diffusion™ - Crypto Markets - 2026-02-06
Today’s DeMark Diffusion™ – Crypto Markets snapshot distills major coins into a single composite alignment signal for a quick read on market heat. The opening chart orders assets by their latest signal; bodies show the mean ±1σ range while wicks capture the historical min–max, with a red diamond marking
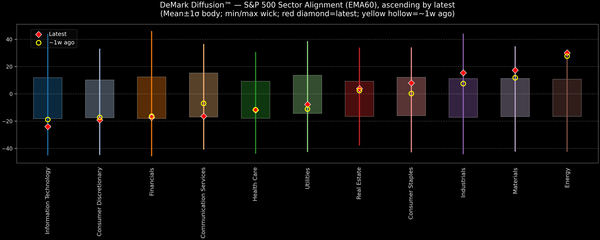
DeMark Diffusion™ - S&P 500 Sectors - 2026-02-06
Today’s DeMark Diffusion™ – S&P 500 Sectors snapshot condenses sector-level price action into a composite alignment signal to gauge breadth and rotation quickly. The opening chart orders sectors by their latest alignment; bodies show the mean ±1σ range while wicks capture the historical min–max, with a red
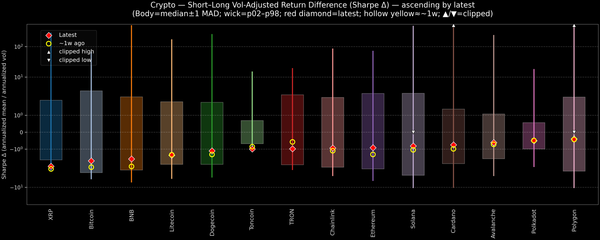
Crypto — Short–Long Vol-Adjusted Return Difference — 2026-02-06
This crypto snapshot compares short-term versus long-term performance on a risk-adjusted basis for major coins. We use log-return annualization, winsorized returns, a dynamic volatility floor, and robust statistics (median/MAD) to avoid outlier distortion. Positive readings indicate short-term strength outpacing the long-term trend; negative values suggest the opposite. Assets are

Price / Gamma Flip — 2026-02-06
This dashboard ranks each asset by where price sits relative to its options gamma ‘flip’ (zero-gamma) level. Names above the flip (green) tend to see dealer hedging dampen moves; below the flip (red) can see moves amplified. These dynamics can evolve quickly as open interest shifts. Top above-flip: NVDA (+6.
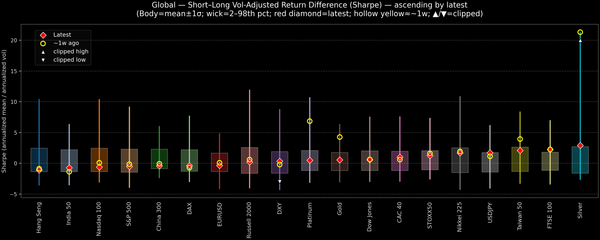
Global — Short–Long Vol-Adjusted Return Difference — 2026-02-06
This snapshot compares short-term versus long-term performance on a risk-adjusted basis. The metric shows how much the near-term, volatility-adjusted return is deviating from the longer-run trend. Positive readings indicate short-term strength outpacing the long-term profile; negative values suggest the opposite. Assets are ordered by the latest reading; bodies show mean
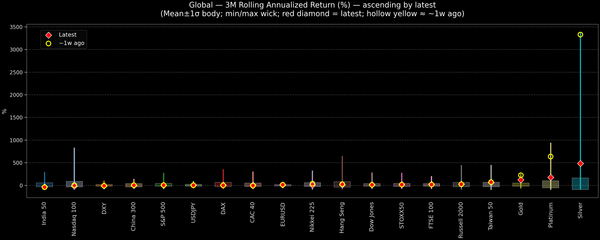
Global — 3M Rolling Annualized Returns — 2026-02-06
This snapshot tracks 3-month rolling annualized returns across global indices, FX, and commodities. Assets are ordered by the latest reading; bodies show mean ±1σ while wicks span historical min–max. A red diamond marks today, and a hollow yellow dot highlights roughly one week ago. Use the selector to switch
markets
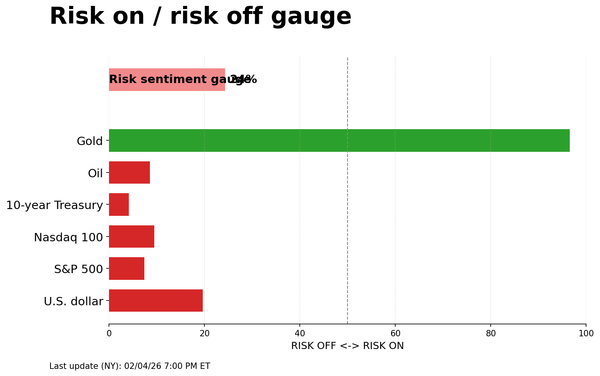
Risk on/off gauge - 02-05-2026
Today’s cross-asset tape skews risk-on: equity futures and oil are carrying the tone while the dollar, Treasurys and gold struggle to attract meaningful sponsorship. The gauge’s one-day read flags a market more interested in adding risk than hiding in classic hedges. The multi-year history tells the more important
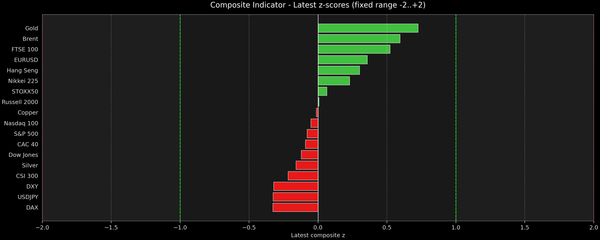
Composite Indicator - Z-score Snapshot (02-05-2026)
This snapshot aggregates seven mean-reverted momentum/oscillator signals into a single z-score, then charts each series against its own history (μ, ±1σ, ±2σ) with a side histogram for context. The bar chart ranks the latest composite readings across assets on a fixed −2…+2 scale.
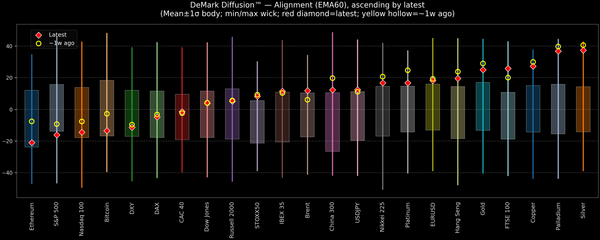
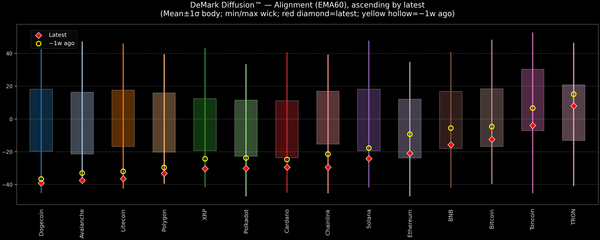
DeMark Diffusion™ - Global Markets - 2026-02-06
Global risk tone remains mixed. US large caps lean steady while breadth shifts beneath the surface; Europe balances resilience with select softness. In Asia, leadership stays concentrated with Japan elevated, while China-linked risk gauges remain more tentative. Crypto continues to search for a durable floor, with swings compressing in places
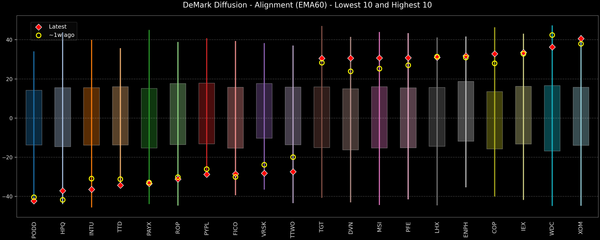
DeMark Diffusion™ - S&P 500 Top & Bottom 10 - 2026-02-06
This DeMark Diffusion™ scan focuses on the S&P 500 names sitting at the extremes of their recent paths. The Top 10 basket groups stocks whose current stance looks rich versus their own history, while the Bottom 10 highlights names that have been pushed to more washed-out territory. Together,