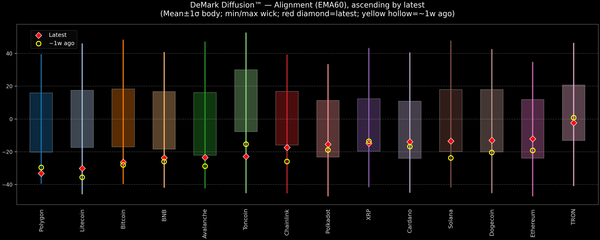
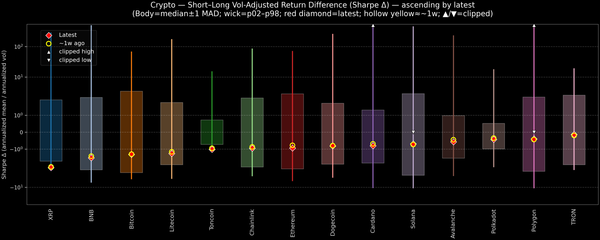
Global — Short–Long Vol-Adjusted Return Difference — 2025-10-27


This snapshot compares short-term versus long-term performance on a risk-adjusted basis. The metric shows how much the near-term, volatility-adjusted return is deviating from the longer-run trend. Positive readings indicate short-term strength outpacing the long-term profile; negative values suggest the opposite. Assets are ordered by the latest reading; bodies show mean ±1σ while wicks span a robust historical range. Use the selector to explore individual panels without clutter.