Price / Gamma Flip — 2026-01-14

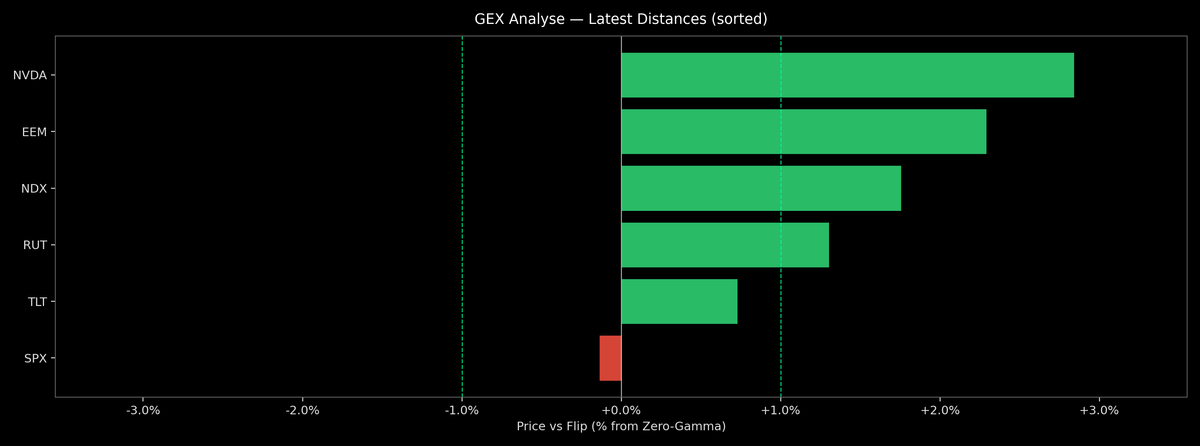
This dashboard ranks each asset by where price sits relative to its options gamma ‘flip’ (zero-gamma) level. Names above the flip (green) tend to see dealer hedging dampen moves; below the flip (red) can see moves amplified. These dynamics can evolve quickly as open interest shifts. Top above-flip: NVDA (+2.8%), EEM (+2.3%), NDX (+1.8%), RUT (+1.3%), TLT (+0.7%) Top below-flip: SPX (-0.1%) Click any ticker to view its strike-by-strike Net GEX with a scaled gamma profile, spot and flip markers.