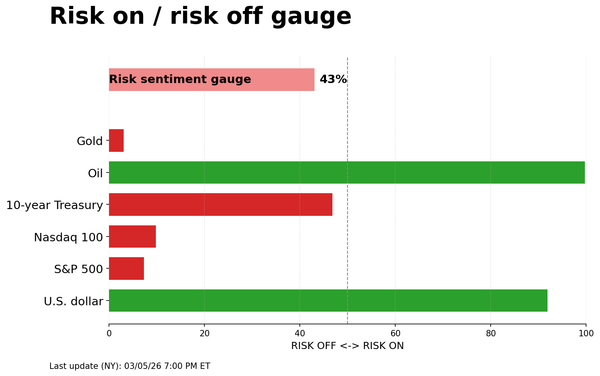
Risk on/off gauge - 11-06-2025

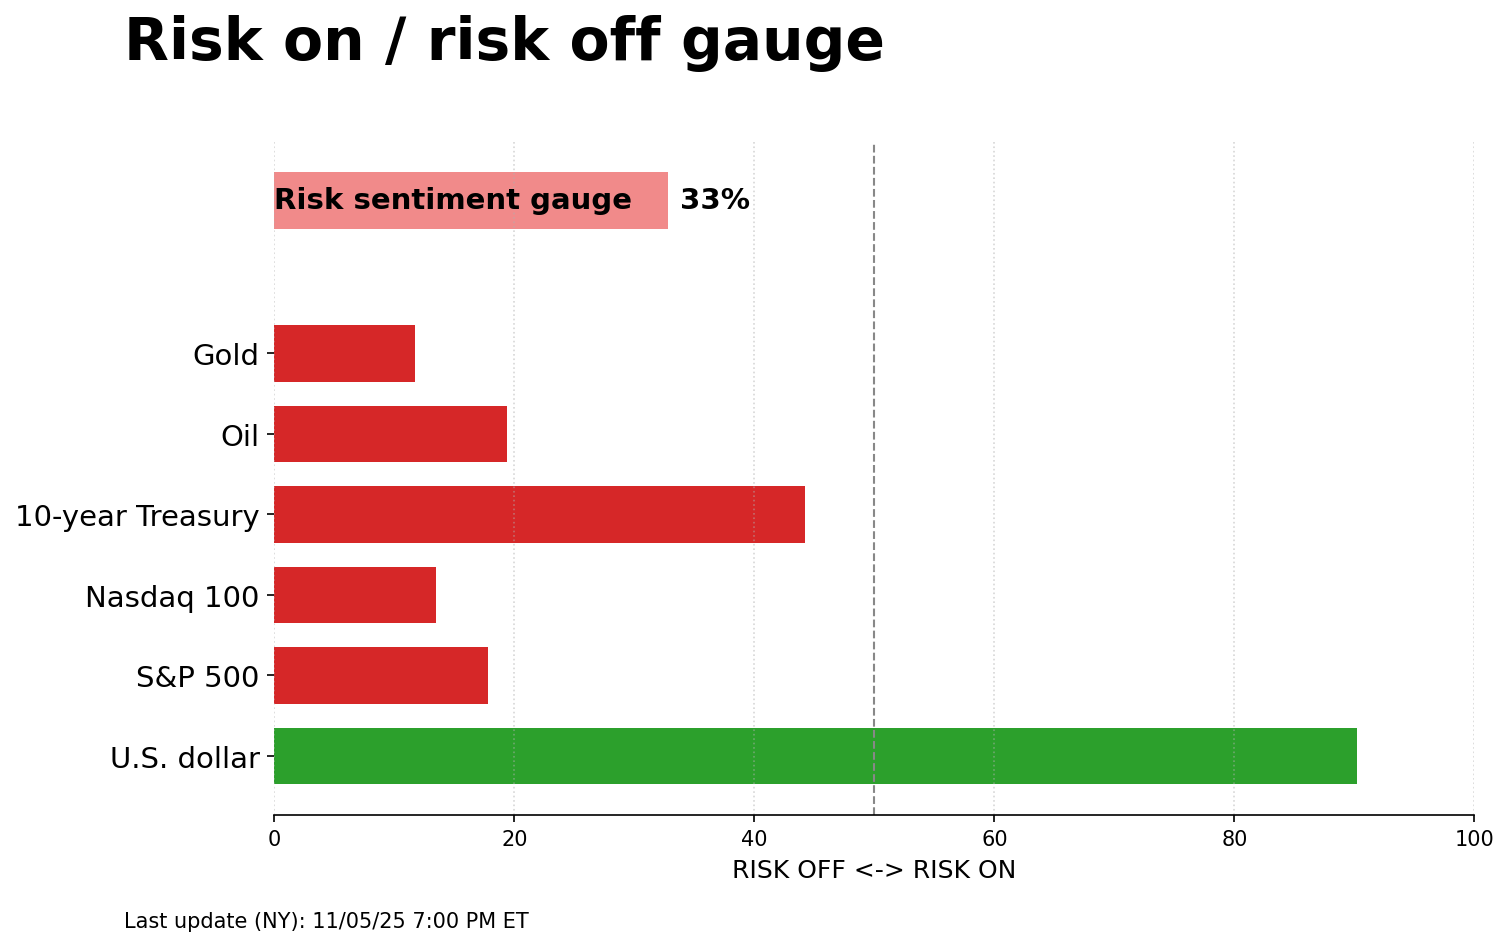
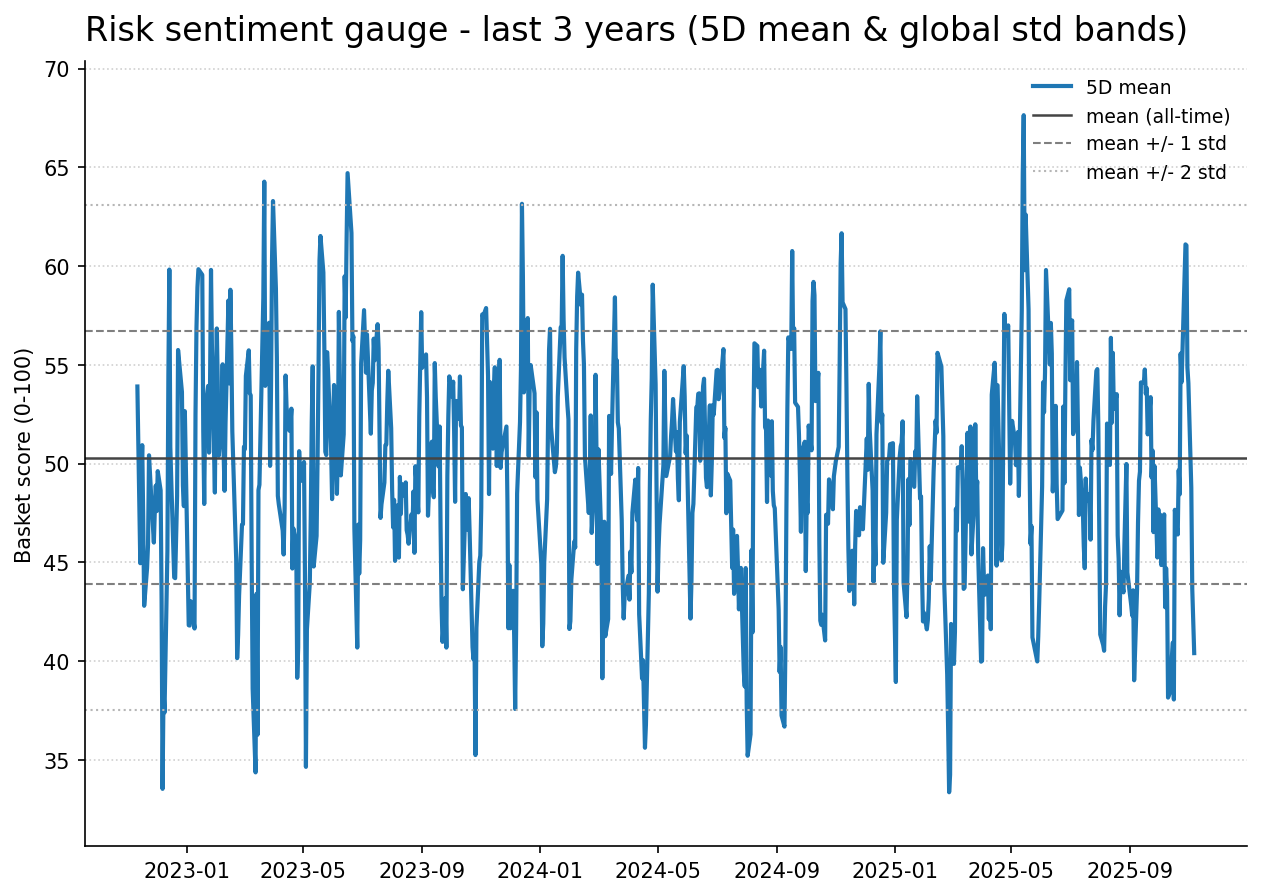
This dashboard condenses cross-asset behaviour into a simple risk lens. The first chart reads the day’s moves across equities, Treasurys, the dollar, oil, and gold, converts them into comparable scores, and averages them into a single "risk sentiment" bar that signals whether markets are leaning toward taking risk or prioritising safety. The second chart places that same composite in a multi-year context, using light smoothing to cut noise and guide-rail bands to show what’s typical versus stretched.