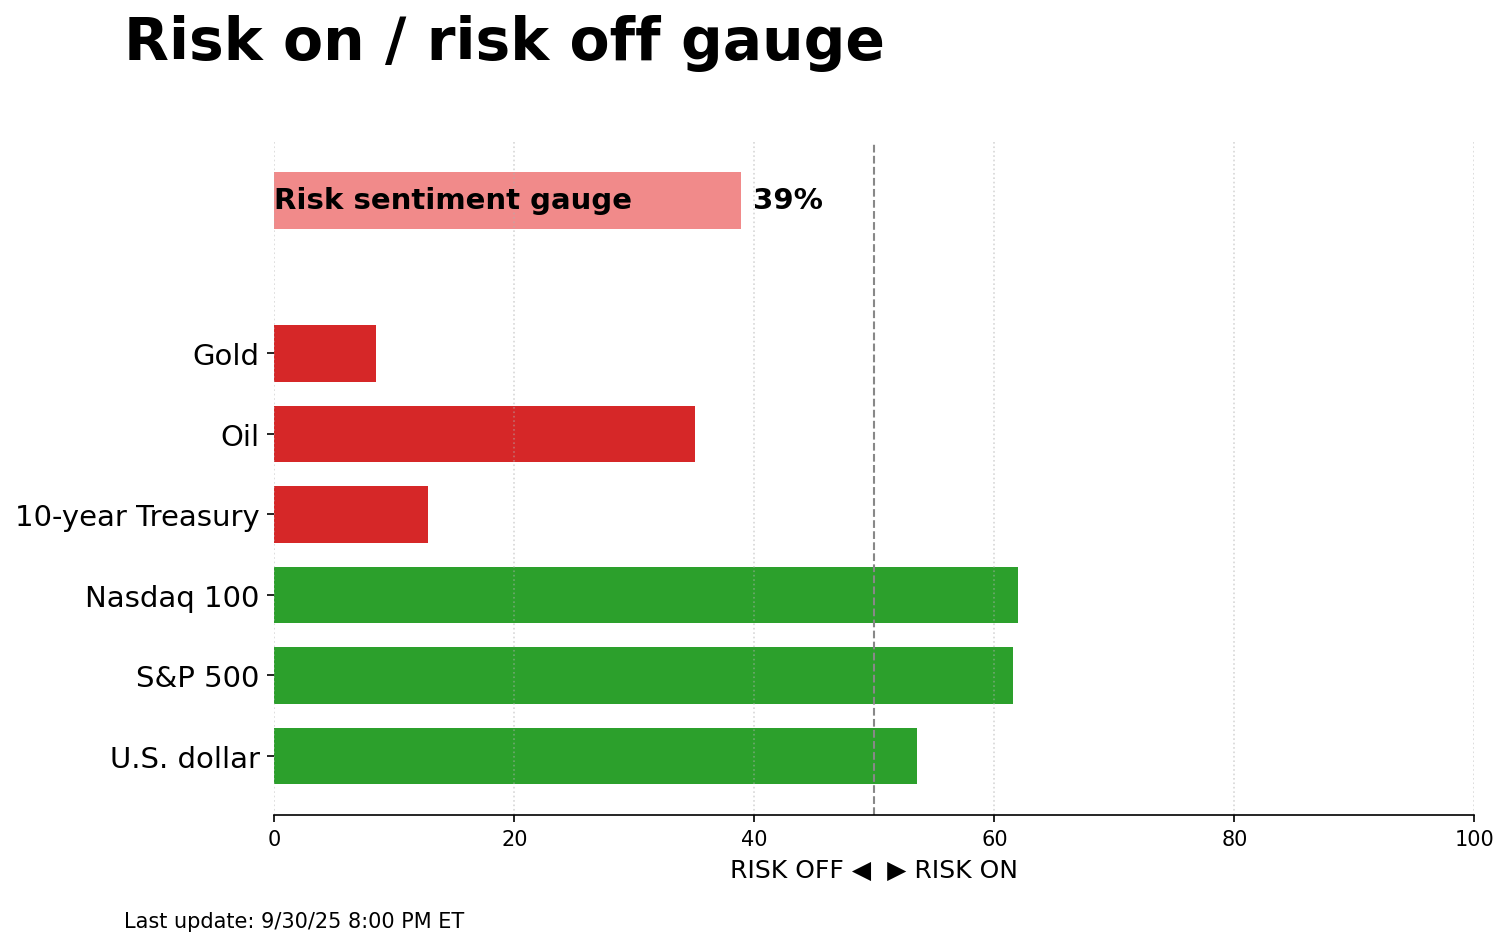
Risk on/off gauge — 2025-10-01

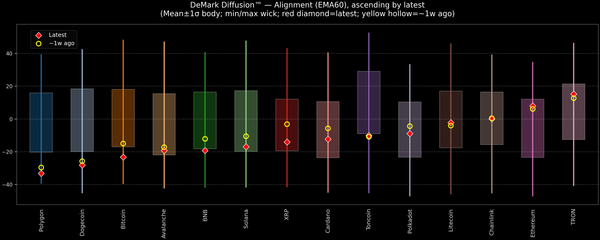
Today’s DeMark Diffusion™ – Crypto Markets snapshot distills major coins into a single composite alignment signal for a quick read on market heat. The opening chart orders assets by their latest signal; bodies show the mean ±1σ range while wicks capture the historical min–max, with a red diamond marking
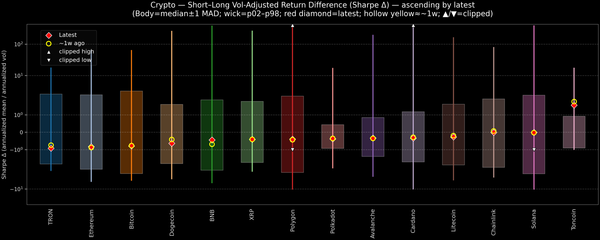
This crypto snapshot compares short-term versus long-term performance on a risk-adjusted basis for major coins. We use log-return annualization, winsorized returns, a dynamic volatility floor, and robust statistics (median/MAD) to avoid outlier distortion. Positive readings indicate short-term strength outpacing the long-term trend; negative
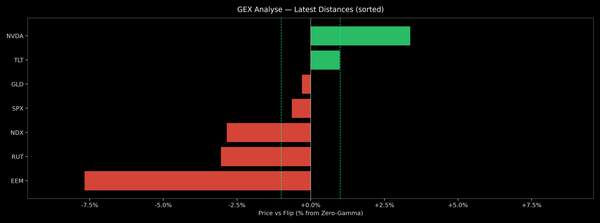
This dashboard ranks each asset by where price sits relative to its options gamma ‘flip’ (zero-gamma) level. Names above the flip (green) tend to see dealer hedging dampen moves; below the flip (red) can see moves amplified. These dynamics can evolve quickly as open interest shifts. Top above-flip:
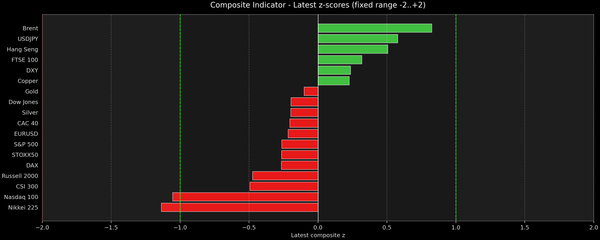
This snapshot aggregates seven mean-reverted momentum/oscillator signals into a single z-score, then charts each series against its own history (μ, ±1σ, ±2σ) with a side histogram for context. The bar chart ranks the latest composite readings across assets on a fixed −2…+2 scale.