💳 Salesforce (CRM) Q4 FY2026 Earnings — Core Brief Edition


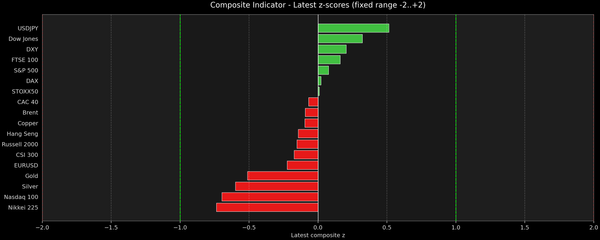
This snapshot aggregates seven mean-reverted momentum/oscillator signals into a single z-score, then charts each series against its own history (μ, ±1σ, ±2σ) with a side histogram for context. The bar chart ranks the latest composite readings across assets on a fixed −2…+2 scale.
Global risk tone remains mixed. US large caps lean steady while breadth shifts beneath the surface; Europe balances resilience with select softness. In Asia, leadership stays concentrated with Japan elevated, while China-linked risk gauges remain more tentative. Crypto continues to search for a durable floor, with swings compressing in
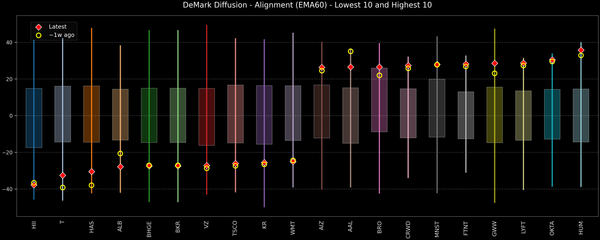
This DeMark Diffusion™ scan focuses on the S&P 500 names sitting at the extremes of their recent paths. The Top 10 basket groups stocks whose current stance looks rich versus their own history, while the Bottom 10 highlights names that have been pushed to more washed-out territory.
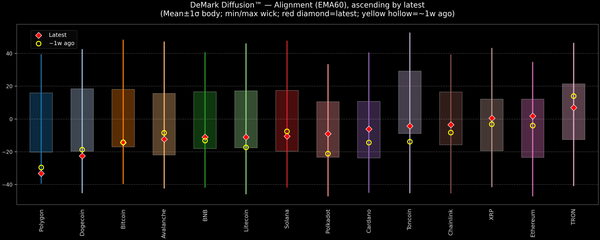
Today’s DeMark Diffusion™ – Crypto Markets snapshot distills major coins into a single composite alignment signal for a quick read on market heat. The opening chart orders assets by their latest signal; bodies show the mean ±1σ range while wicks capture the historical min–max, with a red diamond marking