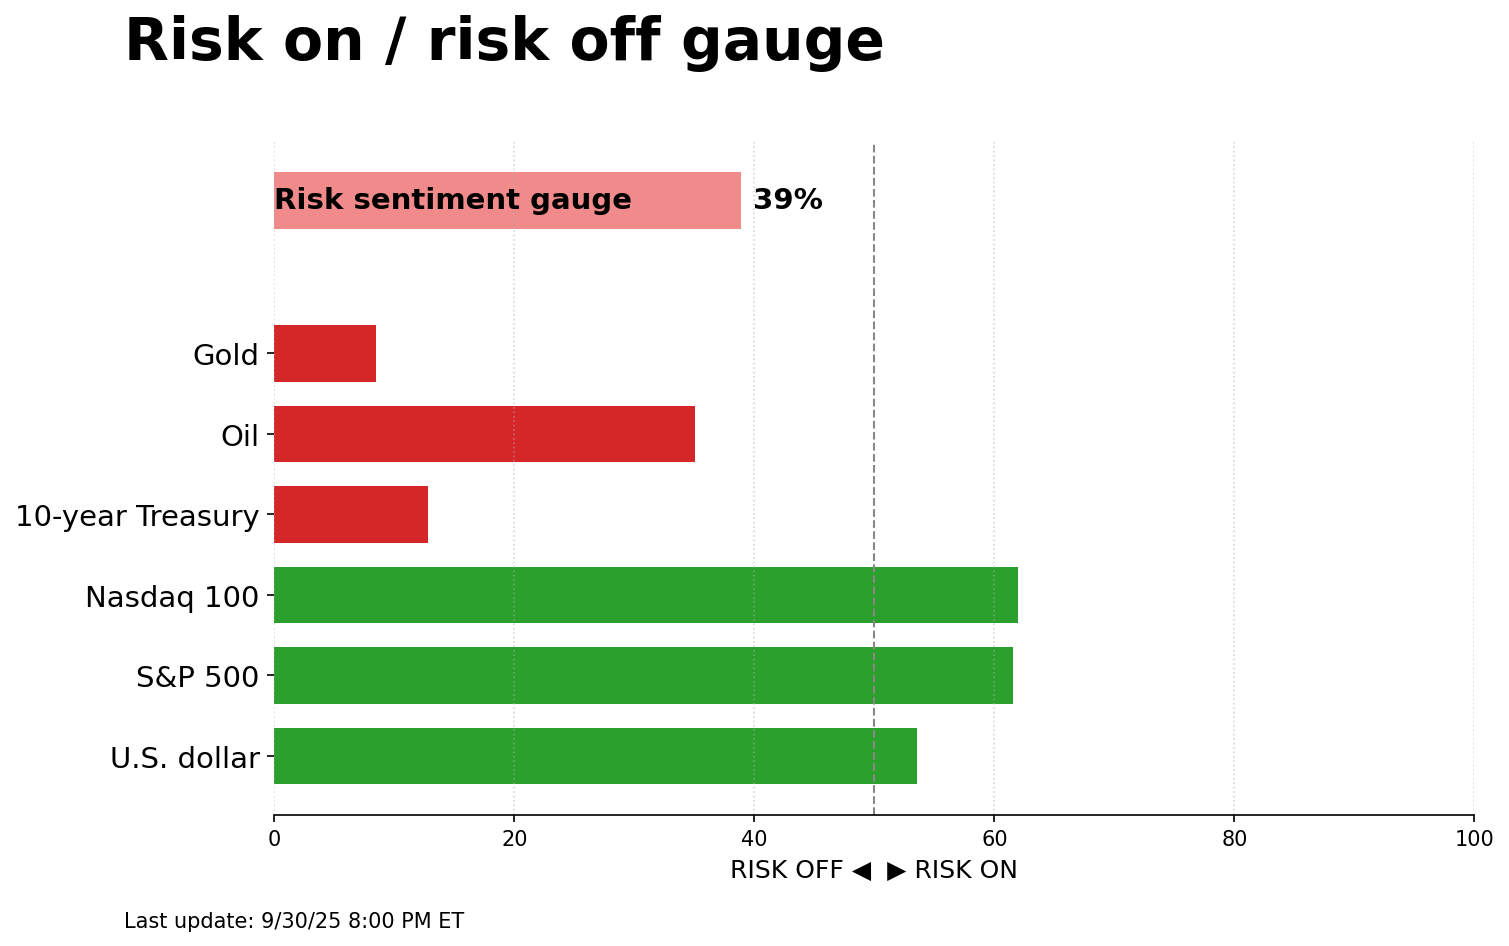
Risk on/off gauge — 2025-10-01


Market Wrap 2026-03-110:00/01× Today's US Market Wrap — Key Points * Stocks mixed amid rising oil, Iran concerns. * Treasury yields rise on oil, inflation data. * Dollar strengthens; Euro eyes rate hike timing. * Oil jumps on Strait of Hormuz worries, IEA plan. * Focus shifts to US jobless claims, oil
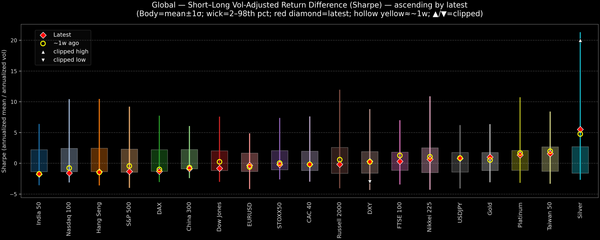
This snapshot compares short-term versus long-term performance on a risk-adjusted basis. The metric shows how much the near-term, volatility-adjusted return is deviating from the longer-run trend. Positive readings indicate short-term strength outpacing the long-term profile; negative values suggest the opposite. Assets are ordered by the latest reading; bodies show mean
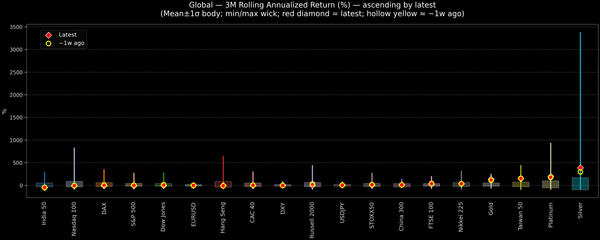
This snapshot tracks 3-month rolling annualized returns across global indices, FX, and commodities. Assets are ordered by the latest reading; bodies show mean ±1σ while wicks span historical min–max. A red diamond marks today, and a hollow yellow dot highlights roughly one week ago. Use the selector to switch
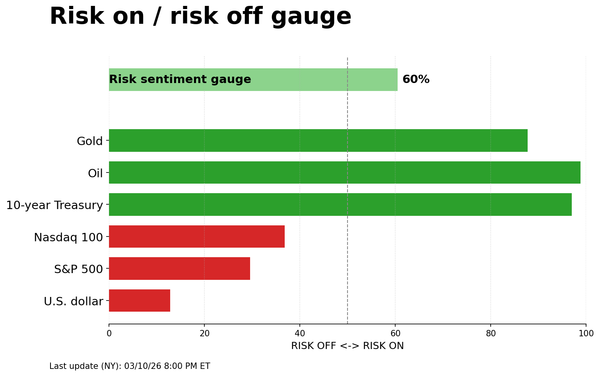
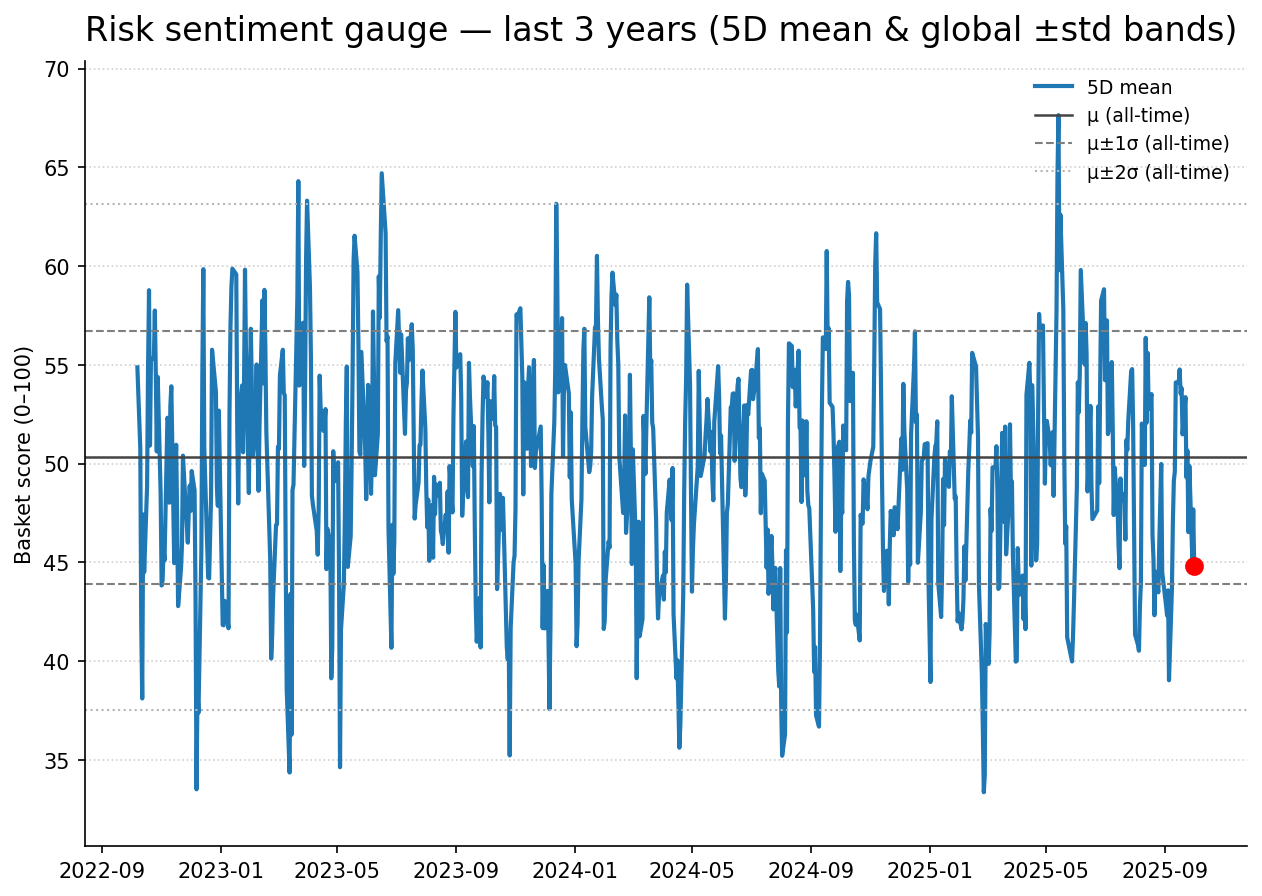
Today’s cross-asset tape skews risk-on: equity futures and oil are carrying the tone while the dollar, Treasurys and gold struggle to attract meaningful sponsorship. The gauge’s one-day read flags a market more interested in adding risk than hiding in classic hedges. The multi-year history tells the more important